I am having a problem with a little application I'm trying to develop. What I do is take a phone with me and drive around the city on a bike.
I collect all the Latitude/Longitude-pairs and at home I plot them on a map.
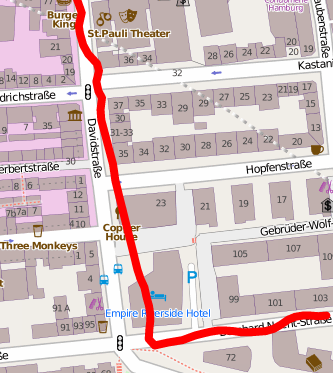
What I get, however, is zig-zag lines, because the GPS location is not perfectly accurate. Here's an example plot:

Obviously I was driving in a more or less straight line and not through the hotel.
How do I get better results, with the red line (and thus the recorded points) being on the roads?
These are the things I've considered:
- Rolling-average over measurements. E.g. take 5 coordinates and calculate average coordinate. Tried it and it doesn't work. It didn't work with the data shown in the picture. (But the line was smoother..)
- Only accepting measurements where the device (iPhone) reports a high accurracy. Tried this and it helps a little bit, but still not good enough.
- Correlating of GPS data with acceleration and direction sensors of the phone. I haven't tried this yet and it sounds non-trivial.
- Using some sort of "Snap to Road"-algorithm.
I think it should be possible to get data on roads for a given location, perhaps using OpenStreetMap. Then perhaps the nearest road and the nearest point on that road from the current position could be calculated and the position could be adjusted to be ON the road. Sort of like the "snapping to grid" function of graphical interfaces.
If this is the right approach, what are some pointers for software and methods I can use?
I assume I will have to deal with the following problems:
- Huge dataset for any given country or city (I'd have to slice tiny portions out, but also store the whole dataset on my own server?)
- Transformation of formats..
- High CPU/memory-usage(?)
- A complex algorithm(?)
Looking at car navigation software it seems that this problem has long been solved. Are there any implementations that can be re-used, preferably of course for the iOS?
I have implemented a simple map matching algorithm:
- I downloaded several hundred MB of road data from OpenStreetMap (OSM) and inserted them into my DB.
- For each measured GPS-point I fetched all OSM-nodes in a certain radius.
- For each fetched node I fetched all roads (series of nodes) from DB and treated them like line segments in 2d-vectorspace.
- I calculated the closest point (distance from gps-measurement) for each segment and selected the one with the shortest distance.
- I've changed the lat-lon coordinates of the measurement to those of the matched point.
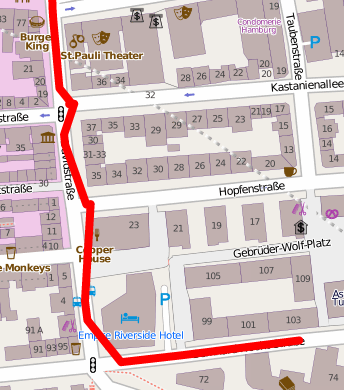
Here is the actual result for the example plot above:

It's just slightly better.
I think the next step is to calculate multiple points in step 4 and use each of them in a probability / plausibility step 4a, where each one is checked for things like wether the bike really took a turn onto another street.
It's not real-time so it should be possible to take the future into account (e.g. to look at the next measurement that followed, or the next few.), and to calculate a probability score for each candidate point.
