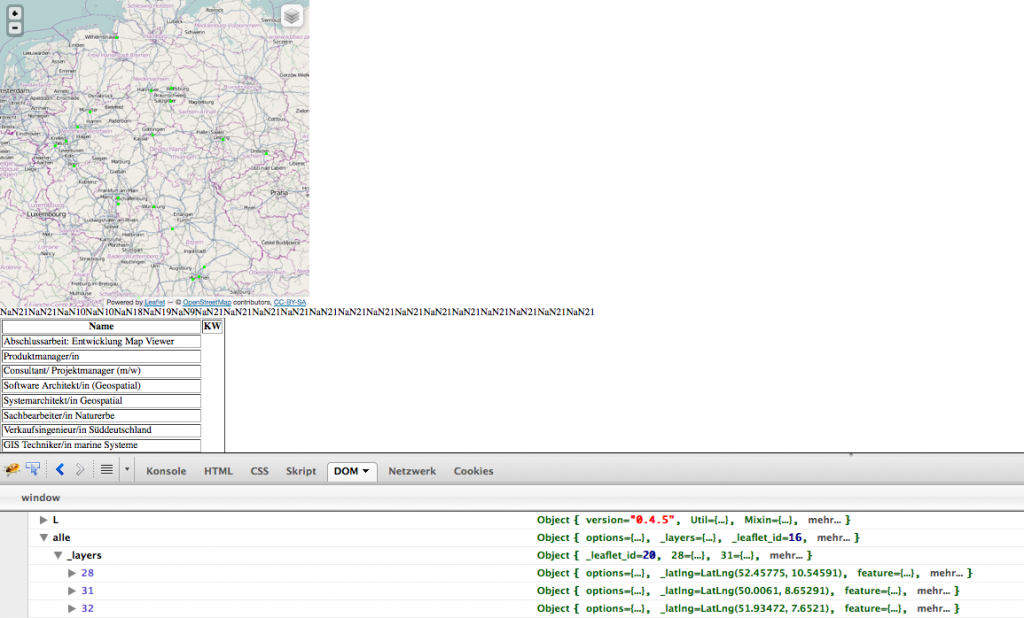
I have just little knowledge about HTML and JavaScript. Nevertheless I was playing, copying and pasting around with Leaflet and CartoDB.
I want to display the features GeoJson in a table. This is what I tried.
var map = L.map('map').setView([51.0, 10.0], 6);

var base = {
"S/W" : L.TileLayer.provider('OpenStreetMap.BlackAndWhite'),
"TOP":  L.TileLayer.provider('Thunderforest.OpenCycleMap'),
"OpenStreetMap": L.TileLayer.provider('OpenStreetMap.Mapnik')
};


window.backupAlert = window.alert;
window.alert = function () {return true};
var alle = L.cartoDB('http://leak-my-brain.cartodb.com/api/v2/sql?q=SELECT * FROM jobsnew', {
pointToLayer: function(feature, latlng) {
return L.marker(latlng, {
icon: L.icon({
iconSize: [4, 4],
iconAnchor: [0, 0],
popupAnchor: [0, 0],
iconUrl: "http://www.zoowelt.org/wp-content/uploads/2013/02/viv_point.png"
})
})
},
 onEachFeature: function(feature, layer) {
layer.bindPopup('<strong>' + feature.properties.title + '</strong><br>' + feature.properties.kw);
}
});

map.addLayer(base.OpenStreetMap);
map.addLayer(alle);


map.on( "zoomend", function( e ) {
    console.log( "zoom level is " + map.getZoom())
}); //zur ausgabe des Zoomlevels in der Konsole
var layersControl = L.control.layers(base,alle);
layersControl.addTo(map);
for (var key in alle._layers) {
  if (alle._layers.hasOwnProperty(key)) {
    backupAlert("hi comment");
  }
};
function writeTable() {
    var out = '';
    for (var row=0; row<1000; row++) {
    if ( typeof(alle._layers[row])=='undefined') continue;
        out += '<tr>'
        + '<td>' + alle._layers[row].feature.properties.title + '</td>' +
        + '<td>' + alle._layers[row].feature.properties.kw + '</td>'
        + '</tr>'
     }
     document.write(out);
 };
This somehow works but there are some issues. The main problem is that the indices in the alle are not starting at 0 and they are not increasing by the step size of 1.

