2

I am working on a Python script to:

  1. compute the vertex coordinates of a geodesic sphere/icosahedron,
  2. project the triangles onto a sphere, then
  3. find which spherical triangle contains an arbitrary point.

I would ultimately like to provide my script with a list of sample point coordinates, and the script would indicate which triangles contain points. These characters would then be used for presence-absence data in biological studies.

I'm mostly done, but struggling with step 3. Is there a fast algorithm to identify whether a point is contained within a spherical equilateral triangle? In two dimensions for general polygons, you can count how many times a ray crosses a perimeter, but this seems challenging to do in three dimensions since the perimeter is curved.

It seems like there should be a clever way to exploit the symmetry of spherical equilateral triangles, but I'm just not seeing it. I don't work with GIS or spherical trigonometry, so just let me know if my question is improperly phrased.

1
  • 2
    Welcome to GIS SE! However, looking at your question, it does not look like there is a clearly GIS component to it so I am wondering whether it might not be better posted to somewhere like our sister site Mathematics.
    – PolyGeo
    Commented Nov 12, 2013 at 20:39

2 Answers 2

2

Using the spherical coordinates, create the icosahedral tessellation and project it with a suitable projection for your work, then apply any GIS to solve this point in polygon problem.


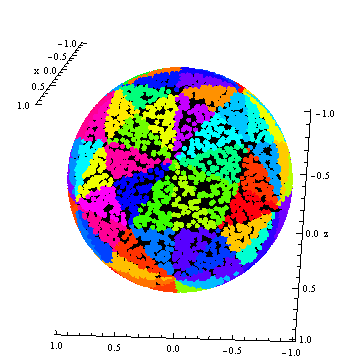
If you want to write your own code, note that each pair of vertices determines a reflection plane (containing the origin) and that points can be classified according to which side of each of the 15 distinct reflection planes they lie on. This classification is actually a finer one than requested, because each of the 20 faces of the icosahedron is further divided into six congruent triangles, giving 120 regions (equal to a fundamental domain for the action of the reflections together with its 119 images).

For the record, a set of normal vectors to these planes (in geocentric Cartesian coordinates) is

X   Y   Z
1-f -f  1
f   -1  f-1
-2  0   0
f-1 -f  1
-f  -1  f-1
-1  f-1 f
1-f f   1
0   -2  0
-1  1-f f
-f  1   f-1
1   1-f f
0   0   2
f-1 f   1
f   1   f-1
1   f-1 f

where f = (1 + sqrt(5))/2 = 1.61803398874989... is the Golden Ratio. (These all point towards the Equator or northwards.) To use them, convert any point (on the sphere or off) into geocentric Cartesian coordinates (x,y,z) and form the 15 dot products with the 15 normals (which essentially multiplies the 15 by 3 matrix by the 3 by 1 vector (x,y,z)'). Classify those products as negative or non-negative, yielding a 15-element Boolean vector. Considering that as a 15-bit binary integer, there are only 120 possible values, one for each of the 120 little triangles. These values encode the desired information about the face (and which part of the face) where the point (x,y,z) is located.

To illustrate, I associated 120 random colors with these codes to display 10,000 random points on the unit sphere:

Figure

Both the icosahedron and its dual, the dodecahedron, are evident.

2
  • This is very helpful and clear. It also seems if I would like to bin a point into higher frequency tessellations, once I know which major triangle contains the point, I can recursively use your approach to narrow down which minor triangle contains the point, so I don't have to perform very large matrix-vector multiplies.
    – mlandis
    Commented Nov 12, 2013 at 22:26
  • You might be interested, then, in the related answer at gis.stackexchange.com/questions/53674/… which demonstrates that recursive approach.
    – whuber
    Commented Nov 12, 2013 at 23:01
0

While this is a very old query, here is an answer in python 3, using SciPy. If you are using a version of SciPy prior to v1.6.0, then use a cKDTree. One can subdivide each triangle into nine sub-triangles repeatedly for finer location without having to worry about changing the lookup methodology.

import numpy as np
import scipy as sp
import scipy.spatial
import math


def xyz_ll(p: tuple) -> tuple:
    x, y, z = p
    return math.degrees(math.atan2(z, math.sqrt(x * x + y * y))), math.degrees(math.atan2(y, x))


if __name__ == '__main__':
# This is a rendering (in unit sphere coordinates)
# of the centres of the 20 faces of a dymaxion icosahedron.
# suitable for equilateral triangles!

    cx = np.array([
        (0.17476898, 0.5231760133333333, 0.5720300666666667),
        (-0.08387563000000002, 0.77832093, 0.13659113999999997),
        (-0.5903144233333334, 0.28559418333333336, -0.44882131666666664),
        (-0.5884910200000001, 0.5302967366666667, 0.0627648033333333),
        (0.6446662, 0.27407261, 0.37518718666666667),
        (0.5903144233333334, -0.28559418333333336, 0.44882131666666664),
        (-0.16999525000000001, 0.11746359000000002, 0.7673197833333334),
        (0.08682595666666666, -0.38238388000000006, 0.69117259),
        (0.5884910200000001, -0.5302967366666667, -0.0627648033333333),
        (-0.22617043, -0.6869057566666666, 0.3293677933333333),
        (0.08387563000000002, -0.77832093, -0.13659113999999997),
        (-0.17476898, -0.5231760133333333, -0.5720300666666667),
        (0.22617043, 0.6869057566666666, -0.3293677933333333),
        (-0.08682595666666666, 0.38238387999999995, -0.69117259),
        (0.6764340433333333, 0.3752631566666666, -0.18190732666666665),
        (0.6417158733333334, -0.12186444, -0.4525765433333333),
        (0.16999525000000001, -0.11746359, -0.7673197833333333),
        (-0.6417158733333334, 0.12186444, 0.4525765433333333),
        (-0.6764340433333333, -0.3752631566666666, 0.18190732666666665),
        (-0.6446662, -0.27407261, -0.37518718666666667)
    ])
    tree = sp.spatial.KDTree(cx)  # this was improved in SciPy 1.6

    # make 100 random unit vectors suitable for a sphere and normalise.
    n = 100 
    v = np.random.normal(size=(n, 3))
    vn = [0, 0, 1] + v / np.linalg.norm(v, axis=1, keepdims=True)

    for pt in vn:
        dx, k = tree.query(pt, workers=-1, k=1)
        print(pt, tree.data[k], xyz_ll(tree.data[k]), dx)

Your Answer

By clicking “Post Your Answer”, you agree to our terms of service and acknowledge you have read our privacy policy.

Not the answer you're looking for? Browse other questions tagged or ask your own question.