5

So I'm making a bike commuting map for our area, and one of the features to show (common on a lot of bike maps) is some type of road grade marker.

We're planning to show three categories: 'kinda steep, pretty steep, and crazy steep' - we're not planning to use those names - but you get the drift. (Actually, four categories - anything less than the first category just doesn't get a marker.) The markers are one, two, or three arrows - here's a clip:
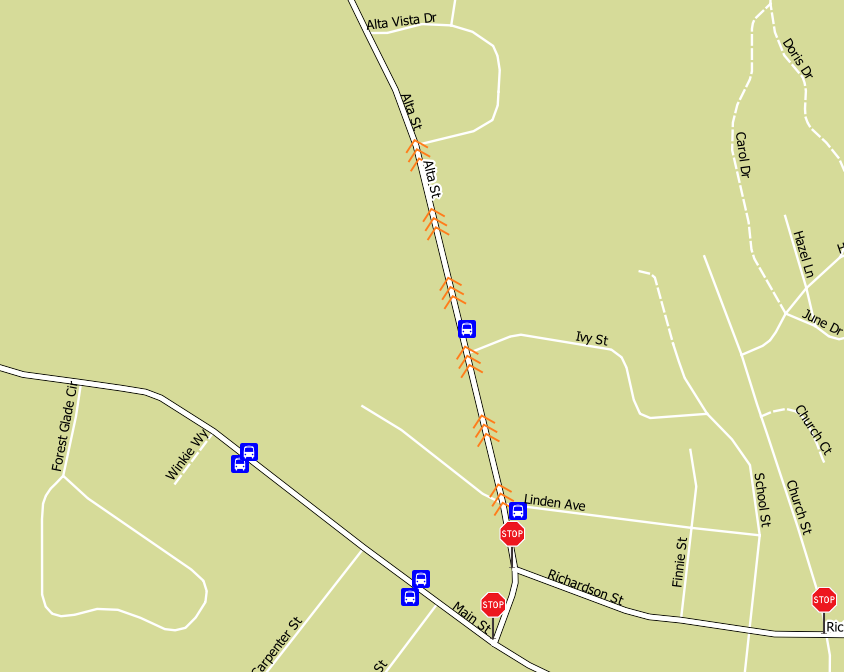
enter image description here

The problem: since we live in the foothills - not much flat stuff around here - the task of getting all the grade markers right is pretty daunting and tedious. So - it would be nice to automate it.

So I've got the DEM for the area from the NED, and got a nice slope raster from it (thanks to folks that helped figure that out). Overlaying that on the bike map (the roads are a vector layer of course), you can see a way to conceptually automate this task. Basically, making a vector layer that is the boolean AND of the roads layer and the slope layer of certain values (whether by categorizing the slope layer, or by making separate slope layers per grade range ahead of time) should get it done. I'd want the output to be a vector layer. But, I'm not quite clear on how to do all that. Suggestions on workflow?

I realize this concept doesn't account for direction (which way is uphill) so I'll plan on doing that by hand (flipping the vector selections as needed, or, doing so with an attribute that is used by the style to decide which way to draw the arrows)

UPDATE: this will be done in QGIS 2. A thought: make a vector layer (of shapes) out of raster categories, i.e. a vector shape of areas with slope between 5 and 10 degrees (this would cover one of the categories of steepness), then do a boolean AND of that layer with the roads layer; so now you have a bunch of disjoint lines; that's exactly what is needed; just style these lines with the double-arrow (or as appropriate for that category), and flip direction of each segment as needed (which is easy to do from memory or from a map if needed).

3
  • 5
    I would like to suggest that you back up a step and rethink the workflow, because a boolean combination of a slope raster and the roads just won't work: it will fail to distinguish roads that are perfectly level (and run along contours) from those that go straight up and down hill. Ultimately you will have to compute the directions in which every road segment heads. How that is done depends on the software you intend to use: please tag your question or edit it to provide that information.
    – whuber
    Commented Dec 31, 2013 at 22:03
  • Tom, you could use the Slope GRID and interpolate the different line segments - this will give you a slope value for each line segment - then you can categorize them! You also could use the original DEM and interpolate the line segements on this - getting the start and end elevations - then you can calculate the direction and average elevation change.
    – dklassen
    Commented Dec 31, 2013 at 22:55
  • added UPDATE at the bottom of the post, incorporating ideas from whuber and dklassen
    – Tom Grundy
    Commented Dec 31, 2013 at 23:53

2 Answers 2

2

I have created a QGIS plugin called walking times, and I believe that the algorithm used is quite close to what you need to calculate the average slope of each line. Actually I was thinking in adding accumulated ascend, accumulated descents and the mean slope to it.

The python algorithm is quite simple:

  • First it will iterate over each line of the layer;
  • In each line, a point cursor will "walk" in regular distances (I use the DEM cell size), and measure the local elevation value;
  • In the next stop, a new elevation is measured and it would be possible calculate the slope;
  • At the end of the line, one can calculate the slope average and save it in a attribute.

You can check the code in the git repository of the project. See the time_calc() function

https://github.com/SrNetoChan/WalkingTime/blob/master/walkingtime.py#L146

This does not answer your question, but I think it can point you to a better solution.

1
  • good point - averaging the slope over a slightly larger distance, i.e. effectively increasing the DEM cell size by walking it like you say. Points out the concept that trying to use a smaller DEM size, the 'signal' is getting lost in the 'noise' - but if you run it through a low-pass filter, since the grade markers would only make sense over a distance of say a hundred yards of road, the 'signal' might become more clear. I'll try out your code, thanks.
    – Tom Grundy
    Commented Apr 14, 2014 at 14:13
0

Well, after more inspection of the DEM and the derived slope layer, I don't think they aren't really accurate enough to use in any sort of straightforward automation.

Basically, looking at the slope pixel values along a few known very-even-grade but steep roads, the slope layer values vary a pretty fair amount over the course of said road - enough to span two or even three of the arbitrary steepness categories.

So, you could come up with some sort of averaging algorithm to make it possible, and you could plug that in to the flow described below, but at this point I think it's more expedient to overlay a range of the slope values (Layer Properties -> Style -> Band Rendering -> Contrast Enhancement = stretch and clip to minmax, then set the min and max to the range of slopes you want to see, example: 2.25 and 13.5 (corresponding to 5%-30% grade)) and use that as a visual guideline; then just copy road segments to the appropriate grade-marker layer, and clip the ends of the lines (with the scissors) to taste; of course if you are setting grade with an attribute you would take different steps there.

Anyway if the DEM were perfect, automation would probably go something like this: 1) make one raster per 'slope range' 1a) on the main slope raster, Properties -> Style -> Band Rendering -> Contrast Enhancement = Clip to MinMax - this will render just one color of gray for the entire range you specify; for 'kinda steep' I'm using 2.25-4.4999; 'pretty steep' = 4.5-6.749999; 'way steep' = 6.75-30 ('15% grade or steeper'). 1b) in the layers list, right click the main slope raster layer, select Save As... Output mode = Rendered image - I haven't actually tried but this should make one raster of the currently displayed range, and all pixel values in that generated layer are the same 2) for each 'slope range' raster, convert the layer to vector using Raster -> Conversion -> Polygonize 3) Vector -> Geoporocessing Tools -> Clip; Input vector layer = the roads layer; Clip layer = the newly polygonized 'slope range' vector layer; Output shapefile will hold disjoint lines which are the road segments at the specified slope range. Style these with no line, just the appropriate number of arrows / hash marks / granny gear symbols etc.

If anyone does come up with a nice averaging algorithm to carry out this automation using the normal 10m DEM-derived slope, that would win!

Your Answer

By clicking “Post Your Answer”, you agree to our terms of service and acknowledge you have read our privacy policy.

Not the answer you're looking for? Browse other questions tagged or ask your own question.