1

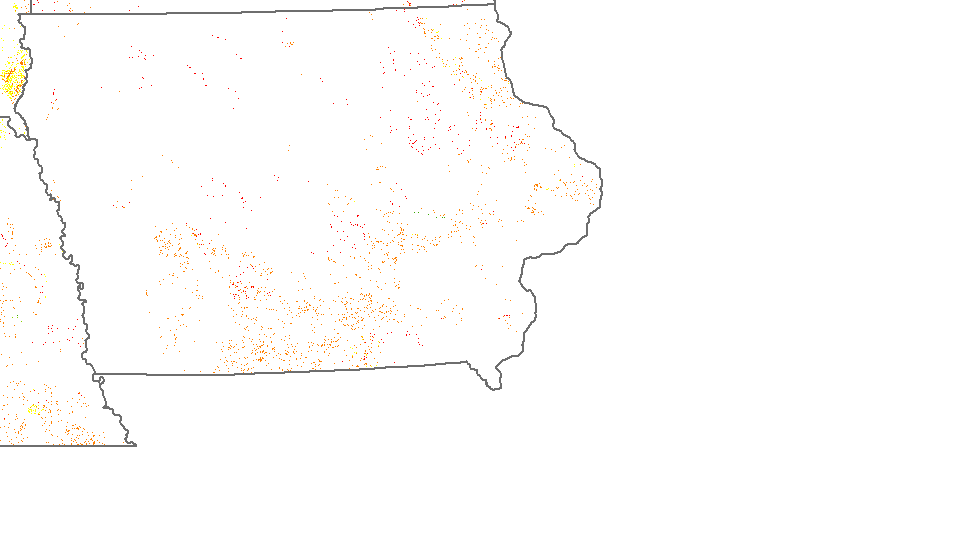
Map of yields in Iowa

In the above map, I am showing yields on some parts in Iowa at a pixel resolution of 100m. However, in this case due to the relatively small number of pixels (and high resolution), the map is not very clear. Is there any way I can smoothen out the raster so that it displays nicely using ArcGIS?

Thanks to @ Michael Miles-Stimson for suggestions, the yields that I am displaying are the 'VALUE' of the raster. Therefore it is not possible to do something like a focal mean (which destroys the raster). I would rather avoid changing the attribute table to use the yields as 'VALUE' because there are several other variables I want to plot as well, and this would loose information and be very time-consuming for my raster.

8
  • 2
    Define nicely! I think what you want is to reduce the resolution of the raster for display purposes but it's hard to tell without knowing the display properties: classifed, stretch, unique values etc... Commented May 18, 2014 at 3:02
  • Sorry, I just want to do some sort of resampling so that the no data areas (currently white) have some sort of value. Not sure if knowing the display properties helps?
    – user1186
    Commented May 18, 2014 at 3:04
  • 2
    If you don't mind breaking the data then you could do a focal max help.arcgis.com/en/arcgisdesktop/10.0/help/index.html#//… with a significant neighborhood (say 1000) this would mean any cell within 1km of a value adopts that value, and if there are two possibilities then it takes the maximum. Commented May 18, 2014 at 3:08
  • 1
    Is it RGB or do you have another value in the data? Commented May 18, 2014 at 3:17
  • 2
    I suggest you edit your question to mention that, it's kind of important. I'm not sure on how to proceed from that.. I guess try it and see what happens or try to move your values into the "value". Commented May 18, 2014 at 3:26

1 Answer 1

2

After some research I think I know a way to focal max the data. The raster is essentially classified (unique value) and the value in the raster is indexed against the table see here in a similar way to an attribute join.

First export the RAT (Raster Attribute Table) using the workflow here.

Second do a focal statistics with a statistics type of MAXIMUM (or minimum depending on how your values go) with a suitable neighborhood.

Last rejoin your RAT to your raster using this method.

Before doing that though you could experiment with set null on your raster, it is possible that it will display and process better if your background value is NODATA and not a value.

After exaggerating the data be sure to store it with an identifier so you remember the values are exaggerated and you do not mistake it for the correct data when doing smaller scale maps.

Hope that helps.

2
  • thank you so much, very ingenious..I am trying this out...
    – user1186
    Commented May 18, 2014 at 11:36
  • 3
    Using extremes (the maxima or minima) sounds like a recipe for creating a map that maximally exaggerates the data. This question seems closely related to the issue of how to create a "pyramid" of coarser-resolution images that approximate the original as closely and faithfully as possible. Indeed, for an actual image a good solution would be to compute block means because they at least preserve average values. More sophisticated methods, such as resampling using cubic convolution or other ways, can preserve additional properties of the original.
    – whuber
    Commented May 19, 2014 at 14:27

Your Answer

By clicking “Post Your Answer”, you agree to our terms of service and acknowledge you have read our privacy policy.

Not the answer you're looking for? Browse other questions tagged or ask your own question.