QGIS version 2.18.5
I'm working with annual house prices in England and Wales with excel columns as: A; Transfer Price B; Postcode C; Lat D; Long. There is approx 400,000 rows of data for 2011.
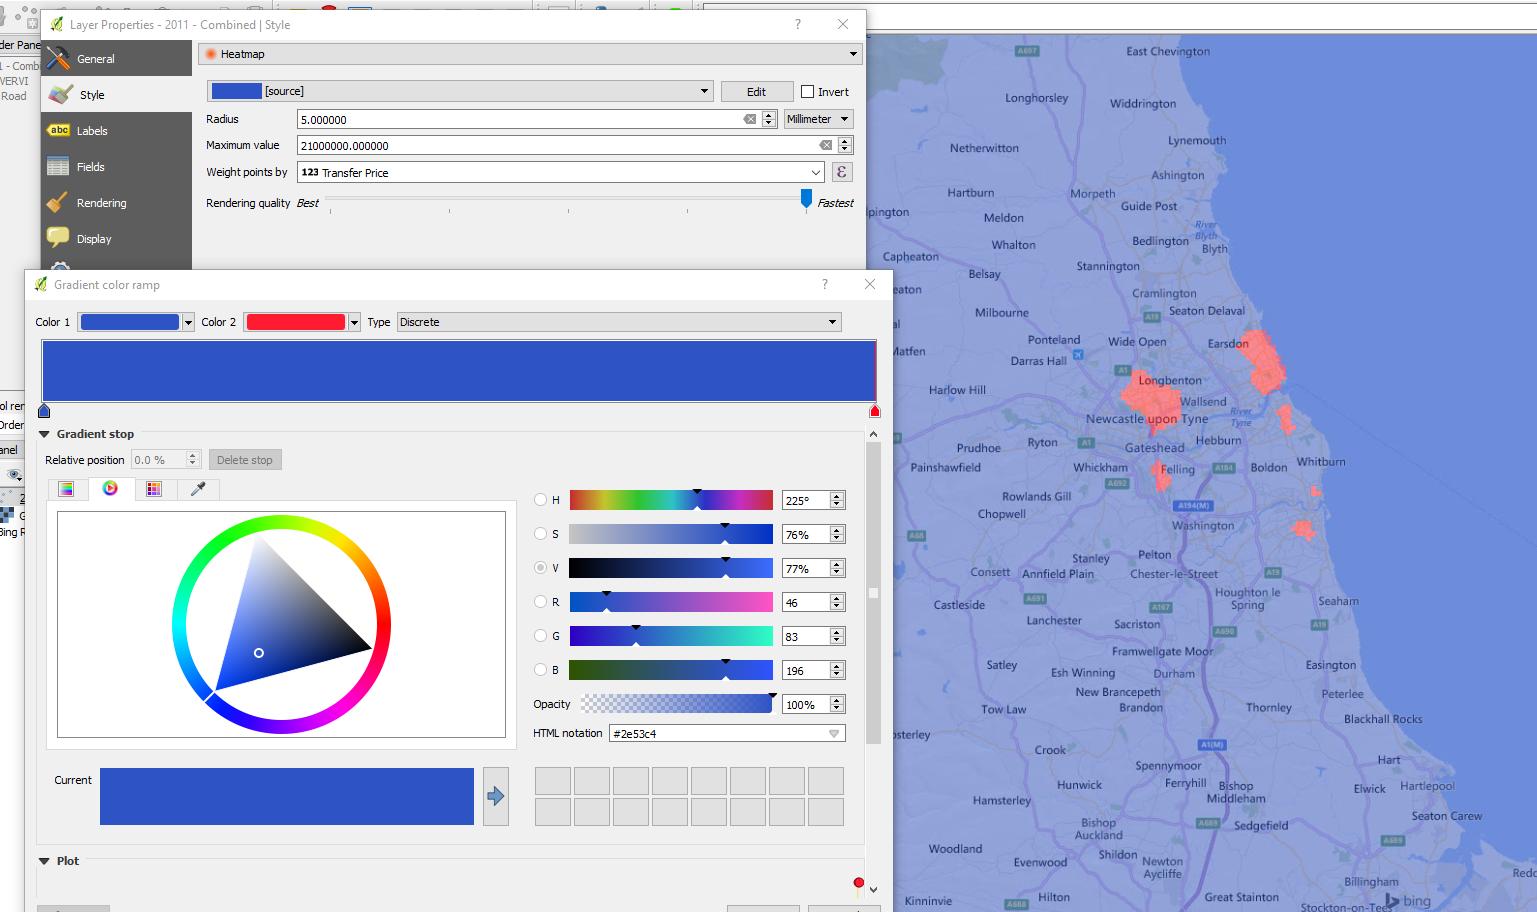
I'm playing around with the colour ramp editor with my points classified by house sale price (transfer price). The highest sale price for 2011 sits at £21,000,000. I've set my gradient colour ramp to 'discrete' with blue up to 99.9% with the remaining 0.1% as red. I've also set the maximum value to 21,000,000.
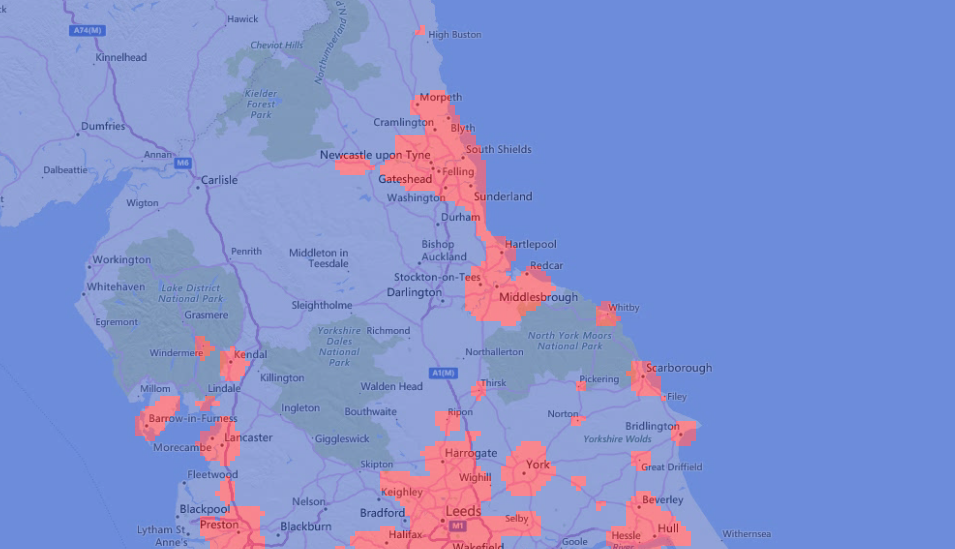
You would think that would single out the house worth 21mill, but I've attached a screenshot of my heat map below which apparently indicates there were multiple billionaires who sold their mansions last year. Can someone explain why this is happening?
I also notice when I zoom out, the red areas just get bigger! Why don't they stay the same size? Clearly I don't understand how a heatmap works...


