40

I have around 1,000 satellite images in tiff format, and I want to create a shapefile which will serve as an index to the rasters. This is something similar to a raster catalog, but I do not want to build a raster catalog.

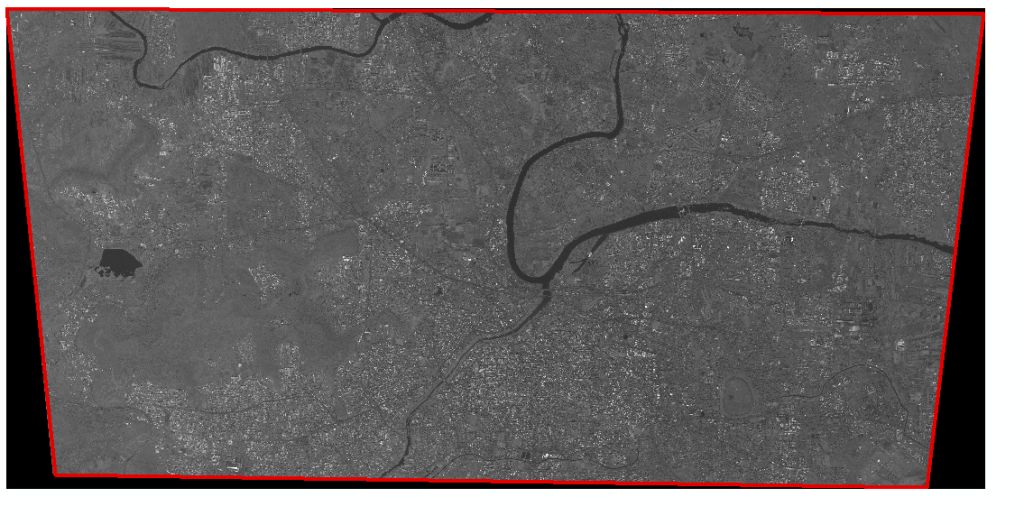
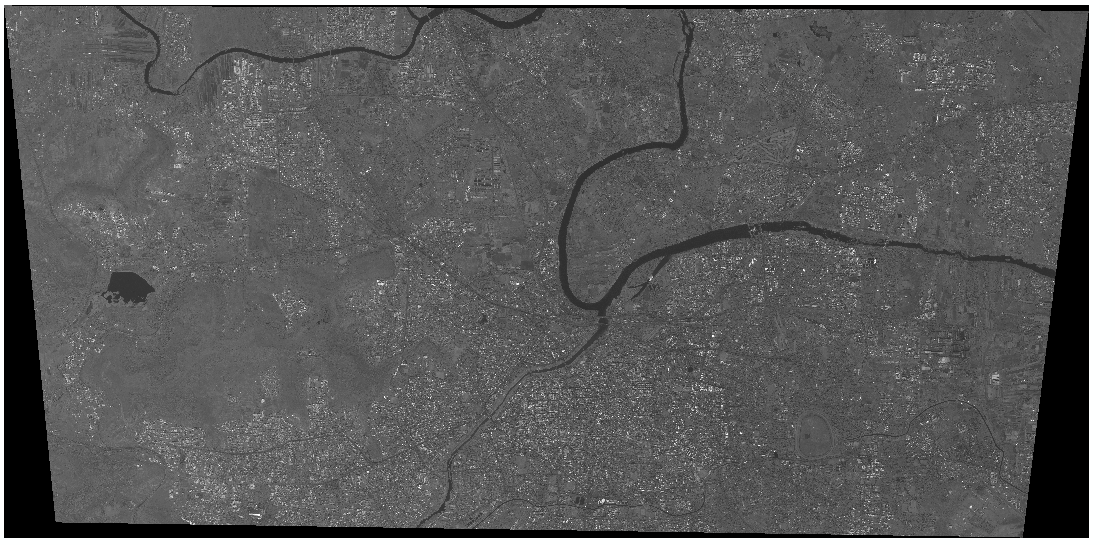
Some obstacles I can forsee, is that the image are georefrenced, so they are not rectangular in shape (I am talking about the data area).

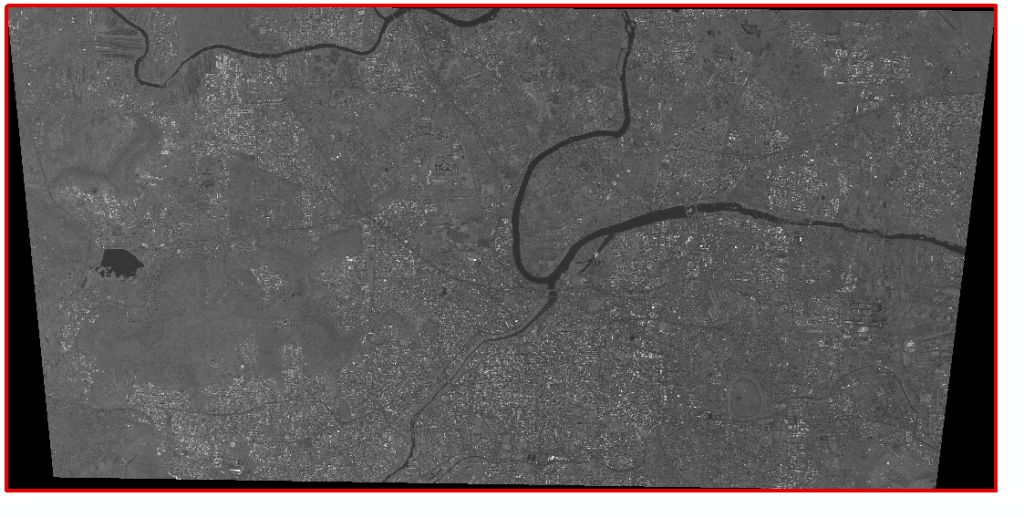
To clarify, I require the polygon to cover only the non-zero (or non nodata) pixels of the raster, and not the entire rectangular raster. Most of the answers so far, give a rectangular polygon, which covers the data, as well as the non-data pixels.

My Image A sample Satellite Image


Result given by tools I have examined (like raster catlog, various Arcscripts, custom Python script given in one of the answers): Result


Result that I want: enter image description here

6
  • 4
    It seems like creating a raster catalog, even temporarily would be a good solution to create footprints. You can create a catalog that is unmanaged, which creates a table of references, but leaves the images in their location on the server. It is easy, and relatively quick to do a batch import of rasters to a catalog. Once created, you can export the footprints to a new featureclass and delete the raster catalog. This might be as quick as other options. Commented Jun 6, 2012 at 7:33
  • 3
    Mosaic dataset also produces the imagery footprint.
    – Roy
    Commented Jun 6, 2012 at 11:12
  • mosaic dataset is the way to go. Very easy to accomplish
    – Brad Nesom
    Commented Jun 6, 2012 at 12:30
  • So in the last image, are the pixels outside the red box NoData or 0? If they are 0, are there pixels in the area you want that are also of 0 value? Commented Jun 7, 2012 at 13:55
  • 1
    The pixels outside the red border are nodata; However my multi-spectral data has 0,0,0 as the RGB values for the nodata areas. In both cases, there are no pixels with value 0 inside the required area. Commented Jun 7, 2012 at 14:42

9 Answers 9

15

There is a plugin in QGIS called Image Boundary. It is a great tool. Within this tool there is an option for "Valid Pixels" which will omit the black edges of a satellite image, for example.

[Update: This plugin does not exist any more as in QGIS 3.12.3. The plugin "Image footprint" exists but it is deprecated and does not seem to work.]

5
  • This plugin claims to do what I wanted, but it is failing on an image that I experimented with. I'll try with my real data tomorrow. Commented Jun 6, 2012 at 13:56
  • I found that this plugin works very well with multi-spectral data, but sometimes gives weird results with single-band pancromatic images. Commented Jun 8, 2012 at 14:25
  • 2
    I agree that the QGIS Image Boundary works the best but is there a tool to do this for vector files where we don't need the "bounding box" or "footprint" but a polygon outlining where data exists.
    – GeorgeC
    Commented Aug 7, 2012 at 6:07
  • The image boundary tools is great, however, the link you provide is 404. I believe the tools is still available if you allow experimental plugins in the plugin settings. Perhaps use this link?: github.com/lmotta/imagefootprint_plugin
    – Aaron
    Commented Feb 27, 2018 at 3:54
  • Is there any documentation for using Image Boundary?
    – Loonuh
    Commented Jan 15, 2019 at 17:08
10

The following code will take an input raster, get it's extent, and insert that extent into a polygon featureclass:

import arcpy

r = arcpy.Raster(in_raster)
point = arcpy.Point()
array = arcpy.Array()

corners = ["lowerLeft", "lowerRight", "upperRight", "upperLeft"]

cursor = arcpy.InsertCursor(fc)
feat = cursor.newRow()
for corner in corners:    
    point.X = getattr(r.extent, "%s" % corner).X
    point.Y = getattr(r.extent, "%s" % corner).Y
    array.add(point)
array.add(array.getObject(0))
print len(array)
polygon = arcpy.Polygon(array)
feat.shape = polygon
cursor.insertRow(feat)
array.removeAll()
del feat
del cursor

You can run it in the ArcMap Python window by setting up in_raster and fc like so:

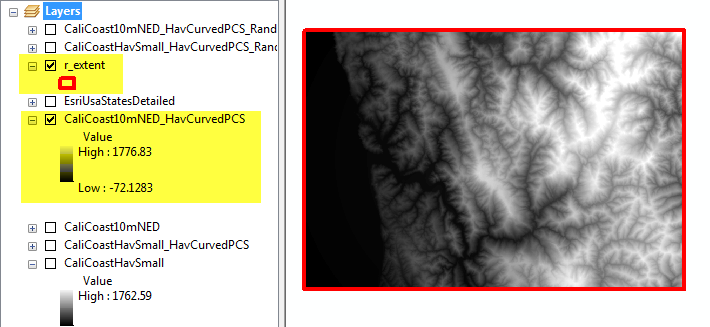
>>> fc = 'r_extent'
>>> in_raster = 'CaliCoast10mNED_HavCurvedPCS'

where r_extent is a existing polygon featureclass. Then just copy the code and run it. I get this:

enter image description here

2
  • 1
    I have use the above code to do the same for a folder: gist.github.com/4162013
    – jeb
    Commented Nov 28, 2012 at 15:33
  • this is useful but will not work for non-rectangular data area. Commented Aug 18, 2021 at 17:49
5

You can use gdaltindex for this: http://www.gdal.org/gdaltindex.html

It will however still create rectangles (eg 4+1 points) in the same reference system as the images. But I wonder whether that really is a problem: how large are your images?

1
  • 3
    The problem with gdaltindex, is that it creates a rectangular polygon for each image. I am only interested in the nonzero value pixels Commented Jun 6, 2012 at 13:57
5

The Previous Answers worked for QGIS 2.x.

If you are reading this after 2020, you will find that the Answers don't work. What Works with QGIS 3.x is the plugin called IBAMA Processing.

Install this plugin, and then you will get the `Create Footprint of Images' tool/algorithm in the Processing Toolbox.

5

Ensure images have defined nodata. If source images do not, fix with something like one of the below, where 0 or 255 is the supposed-to-be nodata value:

gdal_translate ... -a_nodata 0 ... outimage.vrt
gdal_edit -a_nodata 255 somefile.tif

Create small preview images for faster processing (useful when dealing with multi GB satellite images). Skip this step if you want to match value pixels' boundary precisely. I find using the target resolution -tr parameter or choosing an outsize percentage that approximates 2048 rows/columns works well. Three approaches shown, just use one.

gdal_translate -tr 185 185 vendor_image.tif myimage.tif
gdal_translate -outsize 5% 5% vendor_image.tif myimage.tif
gdal_translate -outsize 2048 0 vendor_image.tif myimage.tif

Force pixel values to range between 1 and 255, then rescale again so that data = 100 and all else are nodata. Use to not conserve storage and be much faster also. The reason for scaling twice is to work around the problem of not knowing what range the values might be when we start. There's no meaning to 100 other than by default it draws as a midtone grey, in contrast to the traditional 1 which is visually indistinguishable from black.

gdal_translate -scale -ot byte myimage.tif myimage_8bit.vrt
gdal_translate -scale 1 255 100 100 myimage_8bit.vrt myimage_data_mask.vrt

Create a polygon of the data-only area image mask for all connected regions of pixels in the raster sharing a common pixel value, using 8-way connectedness.:

gdal_polygonize -8 myimage_data_mask.vrt .\footprints\myimage_data.shp

Enjoy! Pink is the normal extents area as created by gdaltindex and similar approaches. Black outline is our new data-only polygon.
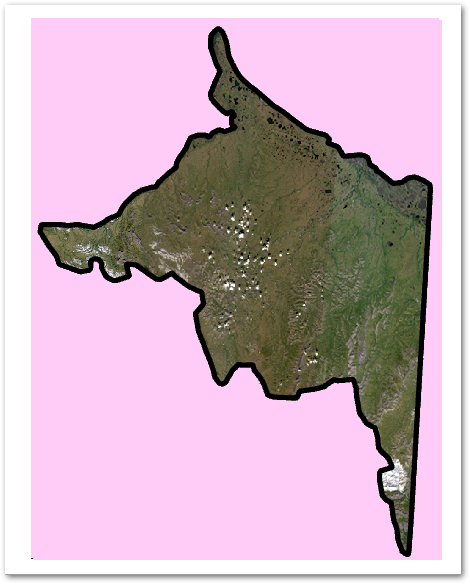
enter image description here

Windows CMD shell bulk processing example

cd .\previews
md .\byte
md .\data-only
for %a in (*.tif) do gdal_translate -scale -ot byte %a .\byte\%~na.vrt
for %a in (byte\*.vrt) do gdal_translate -scale 1 255 100 100 %a .\data-only\%~na.vrt
for %a in (data-only\*.vrt) do call gdal_polygonize -8 %a %~na.shp

Assemble the footprints you've created by the hundred into a single overview index. {AUTO_NAME} populates a field with the name of the source file for that polygon. See ogrmerge doc page for other options.

ogrmerge -single ^
  -src_layer_field_name Image_Name ^
  -src_layer_field_content {AUTO_NAME} ^
  -o ..\index_footprint_data.shp ^
  .\data-only\*.shp
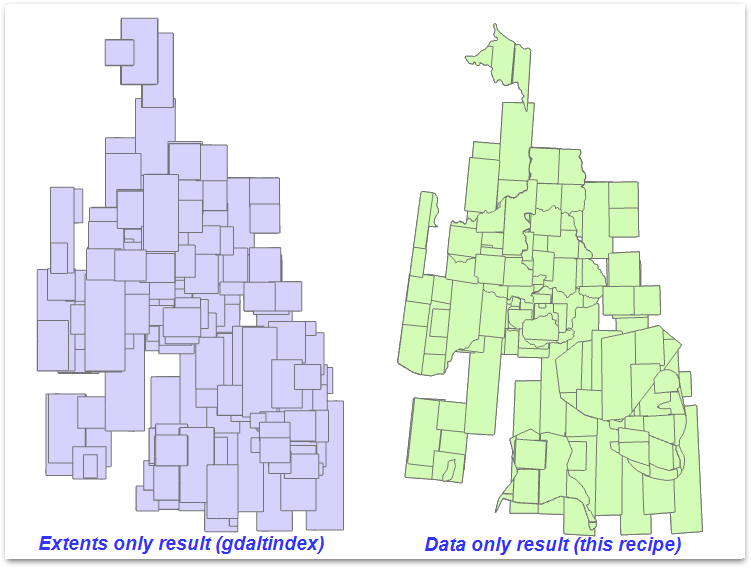
before and after


Thank you https://gis.stackexchange.com/a/139045/108 for rescaling data-only to single pixel value tip. There are other ways of reaching the same end using gdal_calc but I find this scale approach is easier to wrap my head around.

I think I learned about rescaling without knowing the input values ahead of time from Robert Simmon but have lost the reference. You can't go wrong by consulting his General Introduction to GDAL series however.
1
  • This is a nice and complete tutorial on this topic. Just tried and it is working well. Thank you for posting the solution!
    – Richard
    Commented Jun 24, 2022 at 0:56
4

I tried "Image Boundary" tool in QGIS but it fails with some rasters.

Another option that worked for me is:

  1. Convert input raster to a single digital number by using gdal_translate command-line utility.

gdal_translate -co compress=lzw -b 1 -ot byte -scale 1 1 inp.tif out.tif

This will create raster with values of 1 everywhere inp.tif had non-zero values.

  1. Then in ArcMap you can use "raster to polygon" tool to get a polygon (shapefile).

Output shapefile will have non-quadrilateral boundaries, with multiple polygon vertices, following image's actual boundary.

3

If you are interested in a scripted solution, try the gdal command nearblack. You can use the flag -white to retrieve data bounded by white space as well. You can polygonize the output to generate a non-rectangular footprint of the raster data.

##run nearblack
shellcmds = "nearblack -white -o " + outpath + " " + inpath
os.system(shellcmds)

##run polygonize
shellcmds = "gdal_polygonize.py " + outpath + " -f" + """ "ESRI Shapefile"  """ + outpath2 + " nearblack"
os.system(shellcmds)
0
2

In the year of 2023, we need a modern solution.

rasterio provides a good command line tool that quickly solve the problem.

Just use:

rio shapes raster.tif --mask --collection > mask.shp

Ref:

  1. Rasterio Cli Tools doc
  2. My Gist for Mask a raster by another raster(with NoData) using rasterio
1

You could create a raster catalog with a spatial reference assigned, add the raster catalog to ArcMap, and then "Export Footprint". Remember there's the option to create an "UNMANAGED" raster catalog so that you're not making a duplicate of each raster dataset.

Your Answer

By clicking “Post Your Answer”, you agree to our terms of service and acknowledge you have read our privacy policy.

Not the answer you're looking for? Browse other questions tagged or ask your own question.