13

I need to create the polygon outlines of several single layer raster images, not the extent/bounding box, but the area without the nodata values, as shown here: Creating shapefile showing footprints of Rasters?.

In the answer to the question above, the Image Boundary plugin was mentioned, however, I don't find it in the QGIS 1.8.0 Lisboa, running on Ubuntu.

Is the tool still available?

If not, is there a way to do this using opensource tools, either gdal, R, QGIS, GRASS, or similar, not with ArcMap?

1

7 Answers 7

15

I finally found a way to do this:

step 1: gdalwarp -dstnodata 0 -dstalpha -of GTiff foo1 foo2

This does two important things: it sets the destination No Data (outside border) values to 0, and it creates an alpha band.

step 2: gdal_polygonize.py foo2 -b 2 -f "ESRI Shapefile" foo3

The second step uses the alpha band (band 2), created in step 1, and creates a shapefile from that band.

This can then easily be scripted in a bash script, if you have many images, to create exact outlines for.  

3
  • 2
    Brilliant, this solution does not rely on any plugins or software. Creating raster footprints that are sensitive to NoData is one of those GIS tasks that is not as straightforward as it feels like it should be. Commented Jul 18, 2018 at 18:58
  • 1
    When I use this method I end up with a shapefile full of polygons which I assume represent different colors grouped together. How can I avoid this and end up with just a few polygons represent yes-data??
    – Loonuh
    Commented Jan 16, 2019 at 20:17
  • @Loonuh Probably the reason the above didn't work for you is the -b 2 which says use 2nd band and you had a multiband image. The number should be changed to match the Alpha band created in step 1. Also see the related gis.stackexchange.com/a/408628/108, which shows an example of scaling all data values into a single group. Commented Jul 20, 2022 at 16:47
6

Image Boundary plugin did not work for me either, therefore I used the same approach with GDAL. Nevertheless it only worked for me after changing the first step to:

step 1: gdalwarp -srcnodata 0 -dstalpha -of GTiff foo1 foo2

I am working with Landsat8 band (where no data=0) and when using the -dstnodata function I get:

band1 with no data = 'no data'
band2 (Alpha band) = '255' for the entire scene/extent

whereas with -srcnodatafunction I get:

band1 with no data = 'no data'
band2 (alpha band) with no data = 'no data' and valid data = '255' which then allows to extract polygon for valid data only.

I couldn't fully understand the reason behind this behavior (how alpha is computed?) , but I hope this might help others facing the same problem.

5

I used gdal_translate as suggested by the GDAL project.

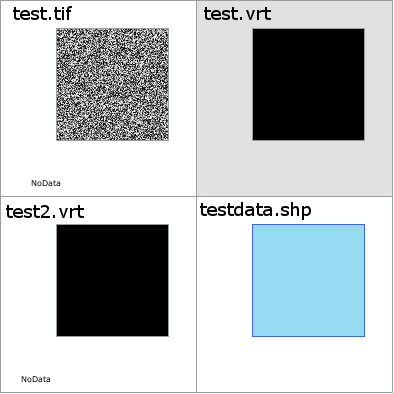
gdal_translate -b mask -of vrt -a_nodata 0 test.tif test.vrt
# Note the  -a_nodata 0 doesn't seem to work when the mask is input, so do another pass
gdal_translate -b 1 -of vrt -a_nodata 0 test.vrt test2.vrt
gdal_polygonize.py -q  -8 test2.vrt -b 1 -f "ESRI Shapefile" testdata.shp

enter image description here

1
  • 1
    With GDAL trunk version it is now possible to use gdal_polygonize directly against the source image osgeo-org.1560.x6.nabble.com/…. Some cleanup is needed for removing the no-data polygons, though.
    – user30184
    Commented Nov 7, 2016 at 15:41
4

You can add the old repository where have plugins out in Official Repository.

http://pyqgis.org/repo/contributed

The image boundary plugin have option for calculate valid pixel, but, the image need be the full scene, how CBERS or Landsat, where this process calculate the first 4 corners. The image need have nodata with ZERO value for area without imaging(scanned by satellite sensor).

Author of Image Boundary

3
  • Hi @lmotta, thanks for for the repository link. The images I'm working on at the moment are all SAR images, with NA values (or -3.4e+38 according to the value tool in QGIS). If one could add the nodata value manually in the tool, instead of having ZERO as the only option, it would be great, otherwise, I might first run a script in R to give my NA values new values of zero. It's a great tool though, thanks!
    – spib
    Commented May 23, 2013 at 8:39
  • Is there a new repository for Image Boundary? The link you provide is 404. Maybe the following?: github.com/lmotta/imagefootprint_plugin
    – Aaron
    Commented Feb 27, 2018 at 4:00
  • Is there anywhere that we can find documentation for Image Boundary?
    – Loonuh
    Commented Jan 15, 2019 at 21:59
0

The Image Boundary stayed obsolete. You can use the Footprint plugin. http://pt.slideshare.net/LuizMotta3/qgis-ibama-imagefootprint

2
  • This plugin doesn't work anymore.
    – luca76
    Commented Aug 16, 2021 at 13:52
  • 1
    The Footprint plugin migrated to Processing Tools. Now "footprint" is a tool. Install the "IBAMA processing" plugin, for add this tool. The plugin run fot LTS version(3.16.x)
    – lmotta
    Commented Aug 24, 2021 at 18:51
0

gdal_footprint, which came out in 3.8.0 (Nov 13, 2023), should do this.

Example:

gdal_footprint -t_srs EPSG:4326 input.tif output.geojson
0

It is also possible to use rasterio and extract the shapes of all connected pixel outlines:

from shapely.geometry import shape
import geopandas as gpd
import rasterio
from rasterio import features

rasterfile= r"/home/bera/Desktop/gistest/four_polygons_rasterized.tif"
dataset = rasterio.open(rasterfile, mode="r")
arr = dataset.read()[0,:,:]

#If your input raster have many values, each unique value will become one polygon.
#Reclassify to either 1 or 0. You dont have to do this.
arr[(arr>0)]=1
arr[(arr<1)]=0

#Vectorize each raster blob
mask = arr>0 #Dont create polygons where the value is <=0
shapes = rasterio.features.shapes(source=arr, connectivity=4, mask=mask,
                                              transform=dataset.transform)

#Iterate over the shapes, each row is a tuple of the geometry and the raster value:
#({'type': 'Polygon', 'coordinates': [[(618821.3726, 6480531.5759), ....), 1.0)

rastervalues = [] #A list for the values
geometries = [] #And geometries
for geom, rasterval in shapes:
    geometries.append(shape(geom)) #Create a shapely polygon
    rastervalues.append(rasterval)

df = gpd.GeoDataFrame(data=rastervalues, geometry=geometries, 
                      crs=dataset.crs.to_epsg(), columns=["rasterval"])
#df.to_file(r"/home/bera/Desktop/gistest/raster_boundaries.gpkg")
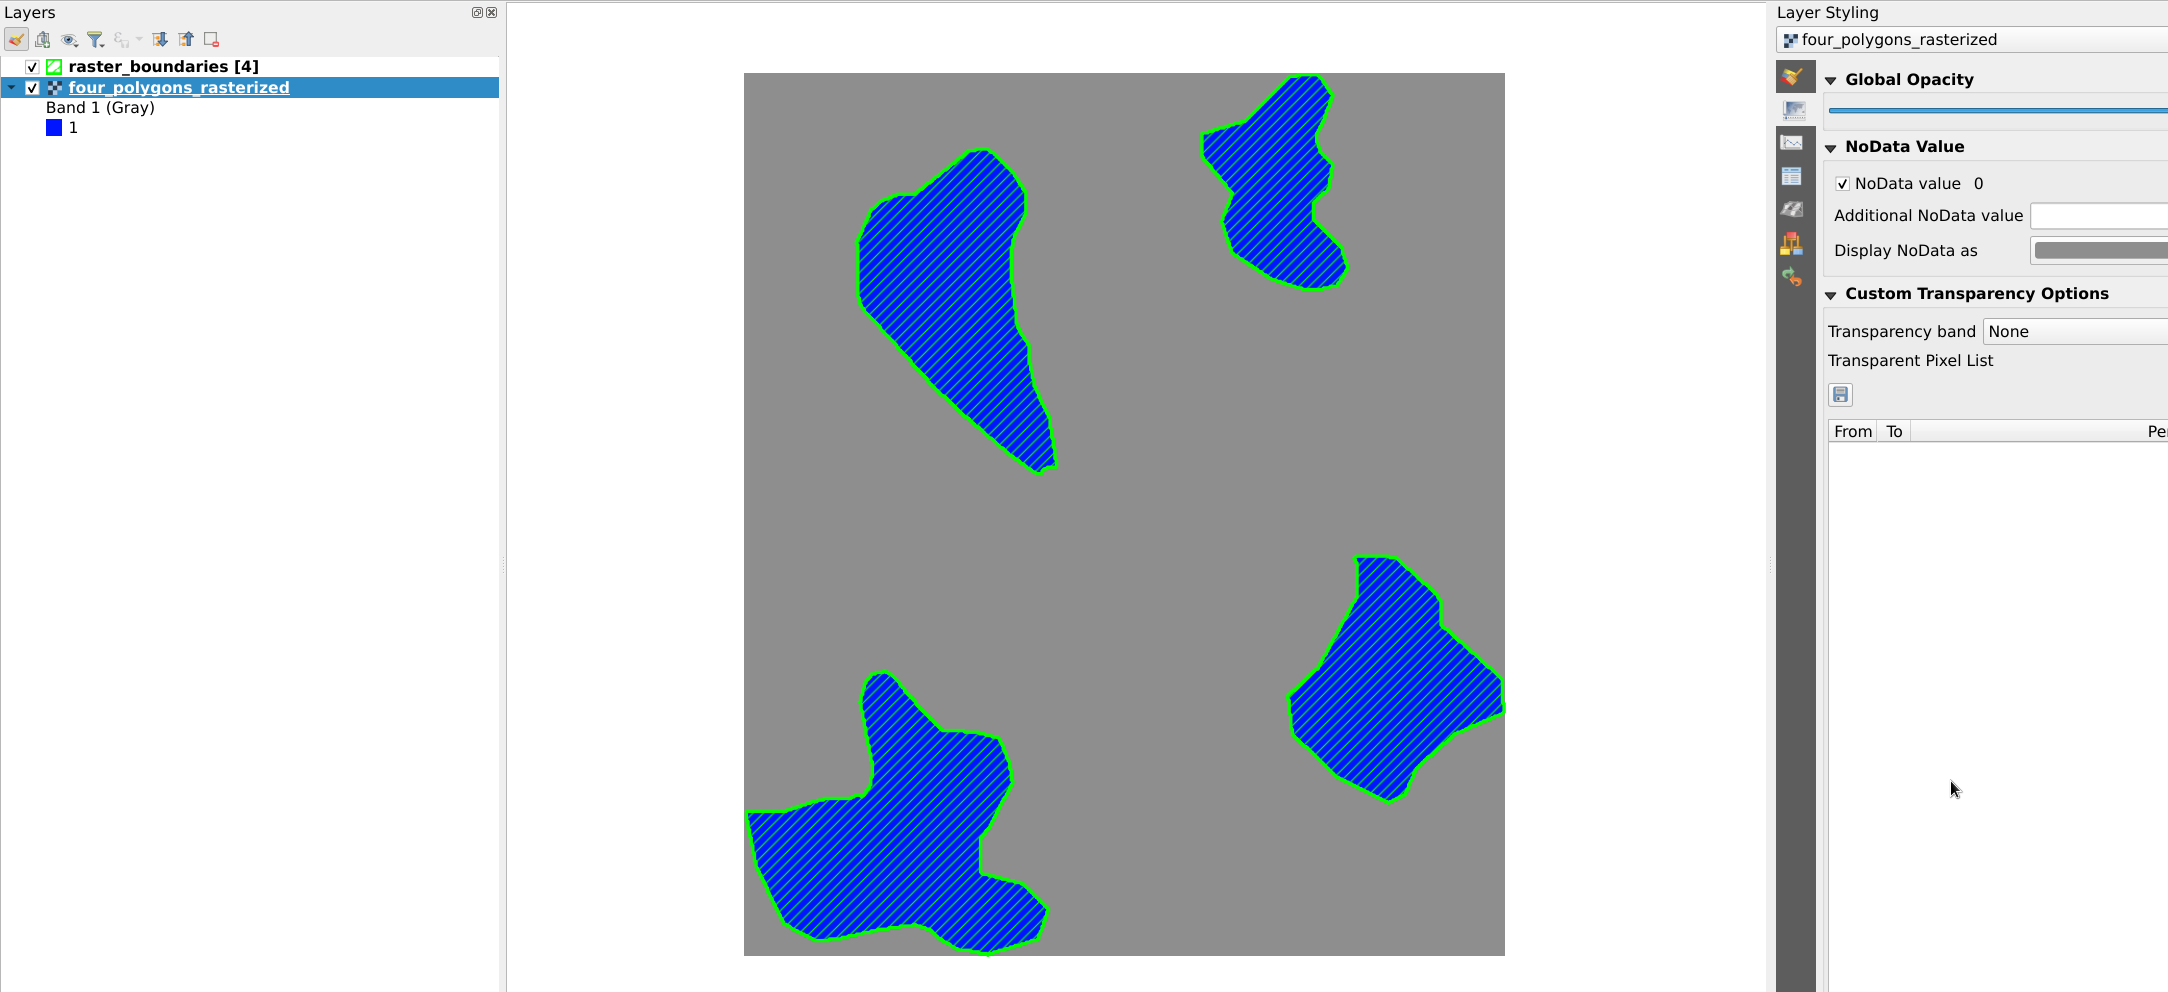
enter image description here

Your Answer

By clicking “Post Your Answer”, you agree to our terms of service and acknowledge you have read our privacy policy.

Not the answer you're looking for? Browse other questions tagged or ask your own question.