0

enter image description hereI'm using ArcGIS 10.3 and the "Legend Wizard" does not offer me a method to include symbol size within my legend. I have my symbols by color in the legend but I would like them by symbol as well, as seen in the example jpg here.

I saw a similar question from a few years ago, but the solution will not work with 10.3.

2 Answers 2

2

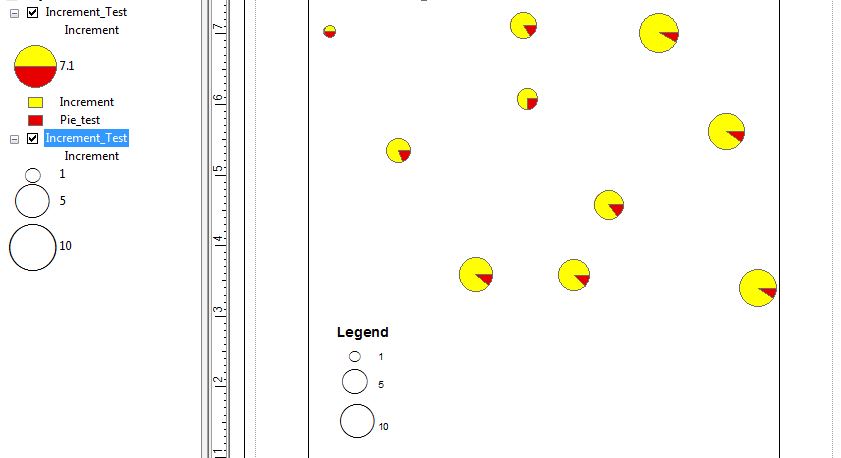
Per the additional info provided by the OP, one way to achieve a range of sizes that correspond to sized pie charts in the map display is to create a copy of the sized pie chart layer and symbolize it using proportional symbols based on the same field. For example: if pie charts are sized using attribute A, then the second layer (ordered beneath the pie chart layer) would be symbolized using proportional symbols also based on A. The next step (somewhat tedious, but AFAIK the only workaround for this), is to set the Min Value symbol size so that it matches your smallest pie chart. In the attached example, the pie chart layer is displayed using default settings/sizes based on attribute A, and the proportional symbol layer is displayed based on attribute A, using 3 classes (user defined #), with a Min Value symbol at 15pt. I didn't expect this to work, but for at least these 10 classes, the proportional symbols scaled almost exactly with the scaled pie charts. There may be some small size discrepancies, but if the goal is to convey a range of values of associated with relative sizes, I think this approach achieves the desired effect. Note that you can also choose any point symbol as your proportional display, so you could choose a half/half point that looked more similar to a pie chart if desired.
enter image description here

3
  • Thanks @jwallace ! I'm Attempting your advice right now. What does the "7.1" next to your legend pie represent? I'm trying to get rid of the # that follows my pie....Thank you! Commented Dec 3, 2015 at 17:01
  • I can't tell what that that number is either...it doesn't seem like a very clear legend display to me. You can get rid of the pie/# part of the legend by selecting a different option from the bottom of the Legend Item Properties where it says "Only show classes from this heading". Alternatively you can turn your labels off in the Legend properties, but you would have to add some text back in for your pie chart colors.
    – JWallace
    Commented Dec 3, 2015 at 20:27
  • Thank you. I ended up changing the legend to graphics and then ungrouping the legend so I could delete the meaningless number. Commented Dec 3, 2015 at 21:21
1

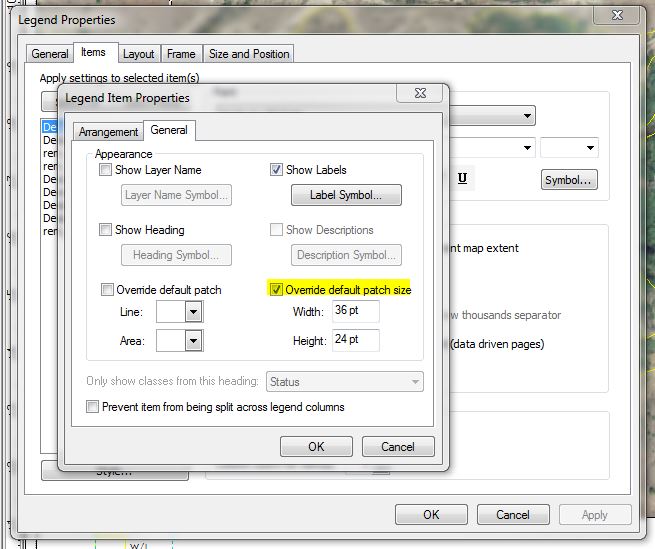
It is a little unclear what you're trying to do, but if you need to manually override the default symbol size that is generated in the legend, this can be modified by right-clicking the layer in the Legend Properties/Items tab, selecting Properties, then General, and then activating the Override Default Patch Size option (see example figure). You may have to play around with the width & height values to get the size you want. If you are trying to have the symbols scale based on some attribute value, then you will need to set up a different layer symbology (e.g. graduated or proportional values). Selecting one of these options will automatically generate scaled symbols in your legend, and can be modified in Layer Properties/Symbology.

enter image description here

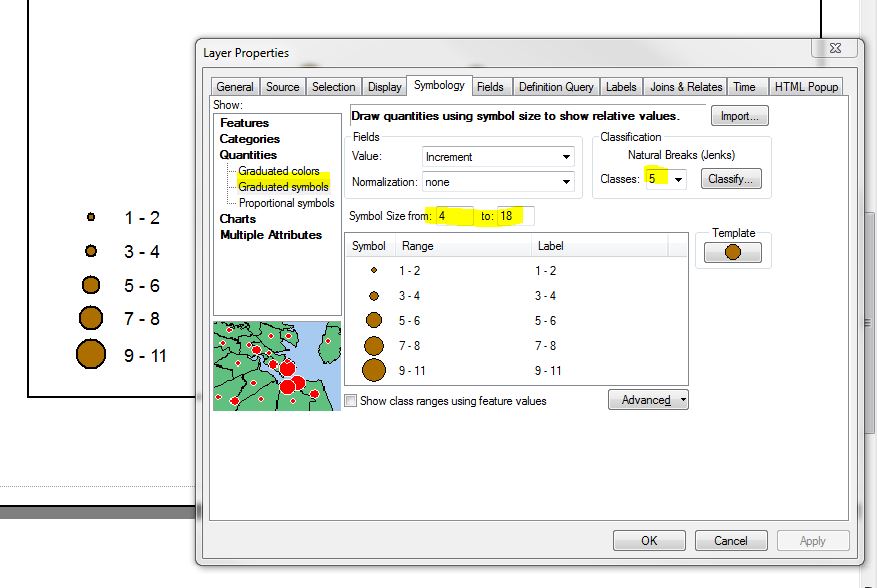
Followup: What you are looking for is Graduated Symbols. This is a symbology option in you Layer Properties. In the Symbology tab, select Quantities-Graduated Symbols from the left menu. You can then modify your classes and the range of symbol sizes using the other options. Your legend will reflect the settings you make here. enter image description here

6
  • Thank you. I added an image of what I would like the right side of my legend to look like. With this new info, which of your tips would be most effective? Commented Dec 1, 2015 at 19:29
  • Updated to provide some more info on graduated symbols
    – JWallace
    Commented Dec 1, 2015 at 20:32
  • 1
    Ack - I was not specific enough again. My apologies. I'm using pie charts...but sizing them based on one feature....That's why I did not use graduated symbols - because I need each point to be a pie. Commented Dec 2, 2015 at 14:05
  • 1
    So the problem is that you can't get the legend to display the range of your pie chart sizes? Or that you don't know how to vary the pie chart sizes in the map display? The legend is going to be problematic (and maybe unnecessary?), the map display sizes can be configured in the symbology properties using either values or attributes.
    – JWallace
    Commented Dec 2, 2015 at 16:11
  • Yes - the issue is that I can't get the legend to display the range of the pie chart sizes! Commented Dec 2, 2015 at 19:15

Your Answer

By clicking “Post Your Answer”, you agree to our terms of service and acknowledge you have read our privacy policy.

Not the answer you're looking for? Browse other questions tagged or ask your own question.