2

I am using ArcMap 10.2 and want to represent a layer in a rotated dataframe with chart (graph) symbology. The problem is that the charts do not rotate with the dataframe:
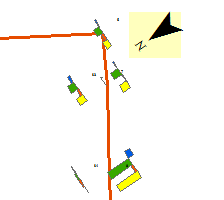
graphs do not rotate with dataframe

I thought I could convert to graphics and rotate each chart individually, but

  1. that is very tedious
  2. I don't find an option to convert a layer to graphics, works for the legend but not for the actual layer symbology

3 Answers 3

1

Do not rotate the Data Frame. Try instead to change the 'Central Meridian' of your selected projection (right-click in the Data Frame and select properties. Switch to Projection tab and double-click the selected projection).

1
  • How would this change the rotation on the symbol? It would simply shift the coordinates. Commented Sep 16, 2019 at 8:12
0

I had the same question... Try this option. http://support.esri.com/en/technical-article/000002834

1
  • 2
    Welcome to Geographic Information Systems! Whilst this may theoretically answer the question, it would be preferable to include the essential parts of the answer here, and provide the link for reference.
    – bummi
    Commented Sep 19, 2017 at 15:07
0

You can designation the rotation of a symbol by creating a rotation field. This is then referenced in the symbology under Layer Properties dialog box, click the Advanced button and click Rotation from the shortcut menu.

Here's a link to the ArcGIS Tutorial

1
  • 1
    thanks, I didn't know about the rotation option. However, the "Charts" symbology option is the only one that lacks the 'Advanced' field, so this doesn't work in my case. Commented Jun 9, 2014 at 14:37

Your Answer

By clicking “Post Your Answer”, you agree to our terms of service and acknowledge you have read our privacy policy.

Not the answer you're looking for? Browse other questions tagged or ask your own question.