3

Does anyone know how to produce the p-value and z-scores in order to do a significance test in the local Moran's I values obtained by the following code?

The input is a remote sensing image: Input
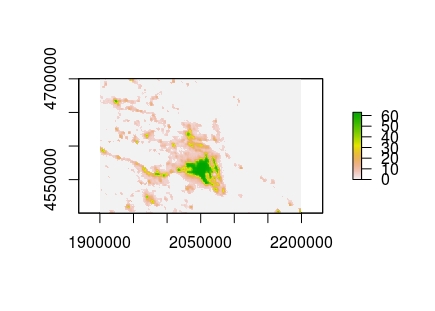
The produced by the code raster showing local Moran's I values is this: output local Moran's I
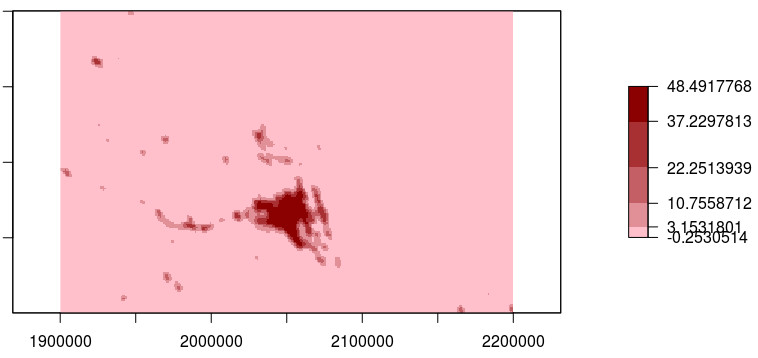
library(raster)
library(classInt)
r <- raster('FIL1992_EL.tif')
r <- crop(r, extent(1900000, 2200000, 4500000, 4700000))  # central EL

m <- MoranLocal(r, w=matrix(c(1,1,1,
                              1,0,1,
                              1,1,1), 3,3))

zClass <- classIntervals(values(m), n=5, style="kmeans")
plot(m, breaks=zClass$brks, col=colorRampPalette(c("pink", "red4"))(5) )
0

1 Answer 1

4

The standard deviate of local Moran statistic (z-score) is derived following:

z = (morans.observed - morans.expected) / sqrt(morans.variance) 

And the p-value for a two sided test, simply:

p = pnorm(z)

However, to return the expected and variance rasters you will need to modify the raster::MoranLocal function directly as, there is no way to derive these statistics on the raster resulting from the function.

Your Answer

By clicking “Post Your Answer”, you agree to our terms of service and acknowledge you have read our privacy policy.

Not the answer you're looking for? Browse other questions tagged or ask your own question.