7

With several point imported from .csv file containing the information of longitude, latitude and VALUE.

To represent the 2-d distribution of value, I want to interpolate the sparse point into 2-d contour figure.

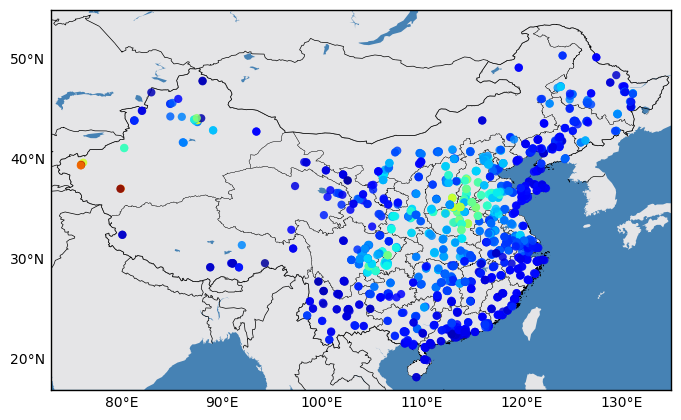
Here is the distribution of the points, the background is China which I want to use as the mask shapefile.

enter image description here

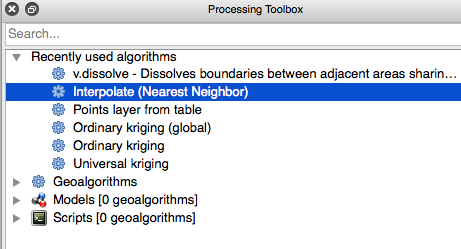
Using QGIS Kriging or nearest algorithm dealing with the point data

enter image description here

They all come with same error: The data source is invalid.

How to fix it. I uploaded my csv data and shapefile here:

(1) CSV containg lon,lat, value

(2) Shapefile of China

3
  • 1
    Just suggestion: export your imported csv as vector layer and than try interpolation.
    – Oto Kaláb
    Commented Dec 25, 2016 at 12:52
  • 2
    Have you considered upgrading your QGIS version to 2.18? Your data can be interpolated successfully using the SAGA tool Nearest neighbour.
    – Joseph
    Commented Jan 4, 2017 at 13:48
  • My version is 2.8.3, that means I need to downgrade my QGIS version? Commented Jan 4, 2017 at 15:12

1 Answer 1

1

Using QGIS 2.18.2, you could:

  1. Use the SAGA tool Nearest neighbour on your point layer.

    Processing Toolbox > SAGA > Raster creation tools > Nearest neighbour
    
  2. Use the Warp (Reproject) tool to reproject the output of Step 1 with the mask of your polygon.

    Raster > Projections > Warp (Reproject)
    

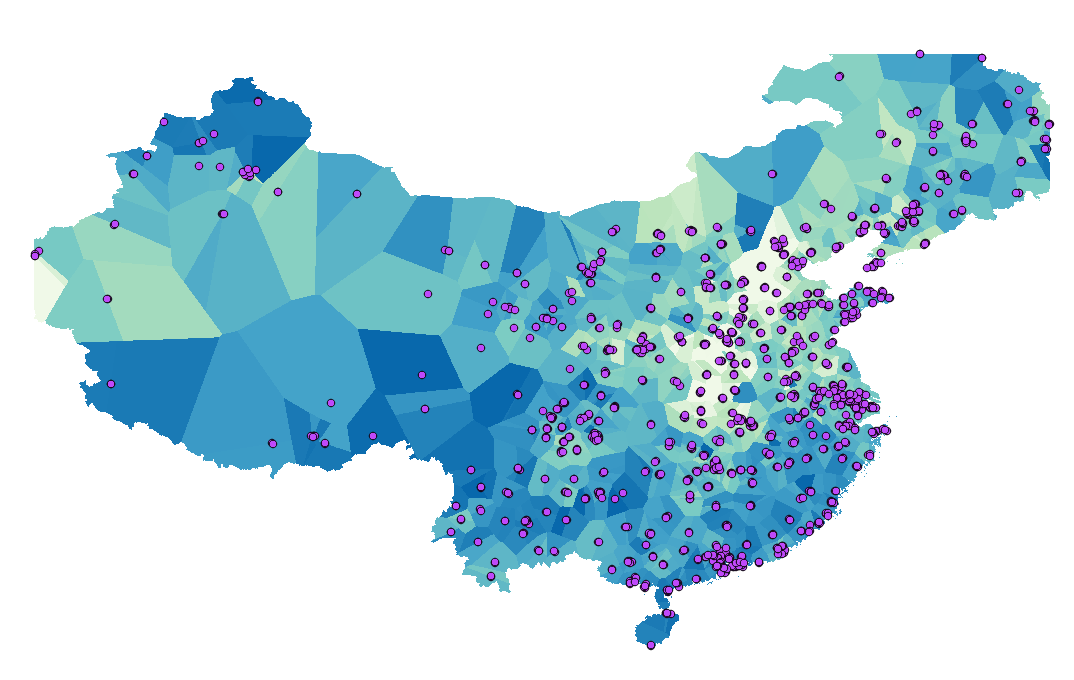
Example using your data with a cellsize of 0.01 (note that the CRS used was the same as your polygon shapefile, EPSG:4326):

Result

4
  • Thanks for your answer. But the figure seems to be consisted of several polygons. Is there any way to generate the continuous contour map? Commented Aug 15, 2017 at 14:34
  • 1
    @HanZhengzu - The figure is the raster result of using the nearest neighbour analysis and then clipping it. If you want it more interpolated, you could lower the value of the cellsize for increased resolution. This would make the output more continuous :)
    – Joseph
    Commented Aug 15, 2017 at 14:45
  • 1
    @HanZhengzu - Or you could resample the result to a finer resolution using the GRASS tool r.resamp.interp.
    – Joseph
    Commented Aug 15, 2017 at 14:52
  • @HanZhengzu - Most welcome! Hope you get the results you're looking for :)
    – Joseph
    Commented Aug 16, 2017 at 9:29

Your Answer

By clicking “Post Your Answer”, you agree to our terms of service and acknowledge you have read our privacy policy.

Not the answer you're looking for? Browse other questions tagged or ask your own question.