5

I use netCDF data from ftp://podaac-ftp.jpl.nasa.gov/allData/merged_alt/L4/cdr_grid

I call gdalwarp as

gdalwarp -of netCDF -ts 480 1080 ssh_grids_v1609_2014122612.nc o.nc

and get

Input file ssh_grids_v1609_2014122612.nc has no raster bands.

How can I change the resolution with gdalwarp of a netCDF file from the link above?

Below is gdalinfo output

gdalinfo -sd 4 ssh_grids_v1609_2014122612.nc

Warning 1: dimension #2 (Latitude) is not a Longitude/X dimension.
Warning 1: dimension #1 (Longitude) is not a Latitude/Y dimension.
Driver: netCDF/Network Common Data Format
Files: ssh_grids_v1609_2014122612.nc
Size is 960, 2160
Coordinate System is `'
Origin = (-79.999997454216626,359.999989825117550)
Pixel Size = (0.166666661362951,-0.166666661953832)
Metadata:
  Latitude#axis=Y
  Latitude#bounds=Lat_bounds
  Latitude#long_name=latitude
  Latitude#point_spacing=even
  Latitude#standard_name=latitude
  Latitude#units=degrees_north
  Longitude#axis=X
  Longitude#bounds=Lon_bounds
  Longitude#long_name=longitude
  Longitude#point_spacing=even
  Longitude#standard_name=longitude
  Longitude#units=degrees_east
  NC_GLOBAL#Conventions=CF-1.6
  NC_GLOBAL#date_created=2016-09-11T18:07:15.140757
  NC_GLOBAL#geospatial_lat_max=79.916664
  NC_GLOBAL#geospatial_lat_min=-79.916664
  NC_GLOBAL#geospatial_lon_max=359.91666
  NC_GLOBAL#geospatial_lon_min=0.083333336
  NC_GLOBAL#Institution=Jet Propulsion Laboratory
  NC_GLOBAL#ncei_template_version=NCEI_NetCDF_Grid_Template_v2.0
  NC_GLOBAL#summary=Sea level anomaly grids from altimeter data using Kriging technique, which gives best linear prediction based upon prior knowledge of covariance.
  NC_GLOBAL#time_coverage_end=2014-12-26
  NC_GLOBAL#time_coverage_start=2014-12-26
  NC_GLOBAL#title=Sea Level Anormaly Estimate based on Altimeter Data
  NC_GLOBAL#version_number=1609
  NETCDF_DIM_EXTRA={Time}
  NETCDF_DIM_Time_DEF={1,5}
  NETCDF_DIM_Time_VALUES=10951.5
  SLA_ERR#_FillValue=9.96921e+036
  SLA_ERR#add_offset=0
  SLA_ERR#coordinates=Sea Level Anomaly Error Estimate
  SLA_ERR#long_name=Sea Level Anomaly Error Estimate
  SLA_ERR#scale_factor=1
  SLA_ERR#standard_name=Sea Level Anomaly Error Estimate
  SLA_ERR#units=m
  Time#axis=T
  Time#bounds=Time_bounds
  Time#calendar=gregorian
  Time#long_name=Time
  Time#standard_name=time
  Time#units=Days since 1985-01-01 00:00:00
Corner Coordinates:
Upper Left  (     -80.000,     360.000)
Lower Left  ( -79.9999975,   0.0000000)
Upper Right (      80.000,     360.000)
Lower Right (  79.9999975,   0.0000000)
Center      (       0.000,     180.000)
Band 1 Block=960x1 Type=Float32, ColorInterp=Undefined
  NoData Value=9.969209968386869e+036
  Metadata:
    _FillValue=9.96921e+036
    add_offset=0
    coordinates=Sea Level Anomaly Error Estimate
    long_name=Sea Level Anomaly Error Estimate
    NETCDF_DIM_Time=10951.5
    NETCDF_VARNAME=SLA_ERR
    scale_factor=1
    standard_name=Sea Level Anomaly Error Estimate
    units=m
1
  • I guess you need to specify the sub dataset explicitly, because some of those will be 1d dimension axes. Use gdalinfo on the file with no options to see those sds names
    – mdsumner
    Commented Jun 1, 2017 at 13:05

1 Answer 1

2

The error message makes sense since the netcdf file stores tables of different size and dimensions. If you run

gdalinfo ssh_grids_v1609_2014122612.nc >out2.txt

you see that there are 5 subdatasets stored inside the file. Alternatively, you can use NASA GISS panoply to investigate the file, and maybe export its tables to CSV.

To resize a subdataset, you have to run either:

gdalwarp -of netCDF -ts 480 1080 NETCDF:"ssh_grids_v1609_2014122612.nc":SLA o1.nc
gdal_translate -of netCDF -outsize 480 1080 NETCDF:"ssh_grids_v1609_2014122612.nc":SLA o2.nc

for every dataset you are interested in.

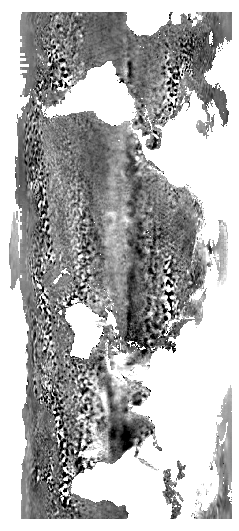
Unfortunately, the X and Y coordinates in the 2D-tables are swapped.

You can translate them to tif files with this command line:

gdal_translate -of GTIFF NETCDF:"ssh_grids_v1609_2014122612.nc":SLA ssh.tif

the file looks like this:

enter image description here

To turn the image to the usual view, you might follow How can I make QGIS interpret coordinates as long-lat instead of lat-long

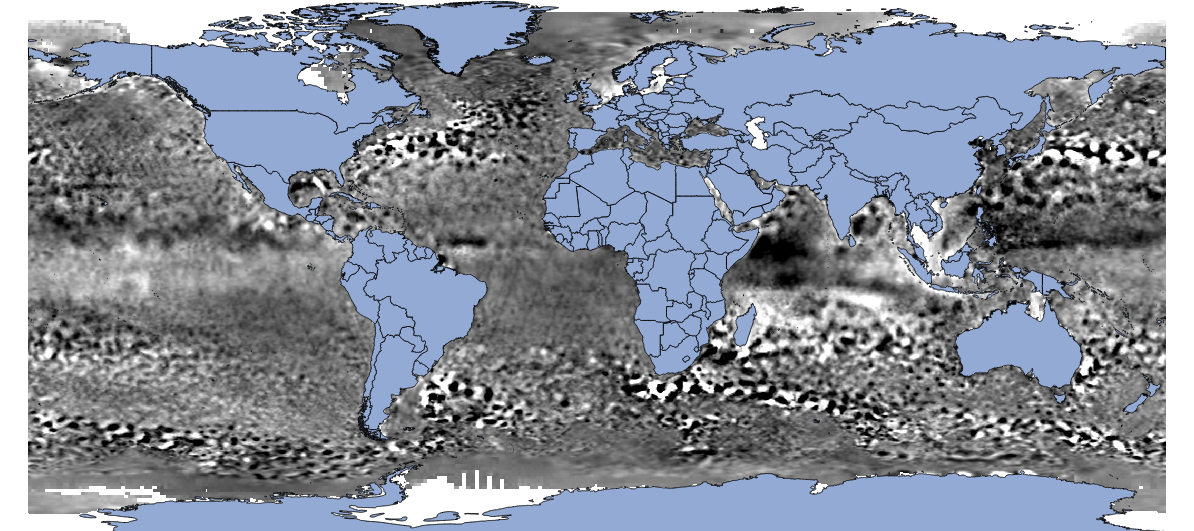
So the full workflow is:

gdal_translate -of VRT NETCDF:"ssh_grids_v1609_2014122612.nc":SLA ssh1.vrt
gdal_translate -of VRT -gcp 0 0 360 -80 -gcp 960 0 360 80 -gcp 0 2160 0 -80 -gcp 960 2160 0 80 ssh1.vrt ssh2.vrt
gdalwarp -r bilinear -t_srs EPSG:4326 ssh2.vrt ssh2.tif
gdal_translate -of VRT -a_ullr 0 80 360 -80 ssh2.tif ssh3.vrt
gdalwarp -t_srs WGS84 ssh3.vrt ssh.tif -wo SOURCE_EXTRA=1000 --config CENTER_LONG 0

to get the right picture:

enter image description here

8
  • We can do far better than export to CSV with the gdal utilities. I consider that bad advice, though Panoply indeed is good for exploring and understanding the file.
    – mdsumner
    Commented Jun 1, 2017 at 13:08
  • Thanks a lot! Great answer. However, I have a number of questions: (i) one of -gcp is 360 while the actual coordinate is 359.91666 (similarly for others). Since I need not only image visualization but its further processing, what are the side effects? Or I should use precise coordinates?
    – Antonio
    Commented Jun 4, 2017 at 14:55
  • (ii) I have errors Warning 1: dimension #2 (Latitude) is not a Longitude/X dimension. Warning 1: dimension #1 (Longitude) is not a Latitude/Y dimension. produced both by gdal_translate and gdalwarp. Why is it so? How to force them to correctly recognise the axes?
    – Antonio
    Commented Jun 4, 2017 at 14:59
  • (iii) is it mandatory to swap the axes using gcp before applying gdalwarp?
    – Antonio
    Commented Jun 4, 2017 at 15:01
  • (iv) how can I convert the resulting GTiff back to netCDF preserving correct metadata as were given in the source file?
    – Antonio
    Commented Jun 4, 2017 at 15:02

Your Answer

By clicking “Post Your Answer”, you agree to our terms of service and acknowledge you have read our privacy policy.

Not the answer you're looking for? Browse other questions tagged or ask your own question.