14

I have drawn an OD flow map using QGIS geometry generator, using the following expression :

make_line( centroid( $geometry ),
centroid( geometry( get_feature( 'Layer2', 'Attribute1', attribute(
           $currentfeature, 'Attribute2') ) ) ) )

I got everything fine, defining the width of my lines according to attributes.

But when I zoom to the "hub", lines linked to places outside of map canvas doesn't show up. I guess it's because the features are not supposed to appear on the map.

I tried to uncheck the "Clip features to canvas extent" option in the advanced menu, both in the "Geometry generator" and in the "Line" levels, but it still doesn't appear.

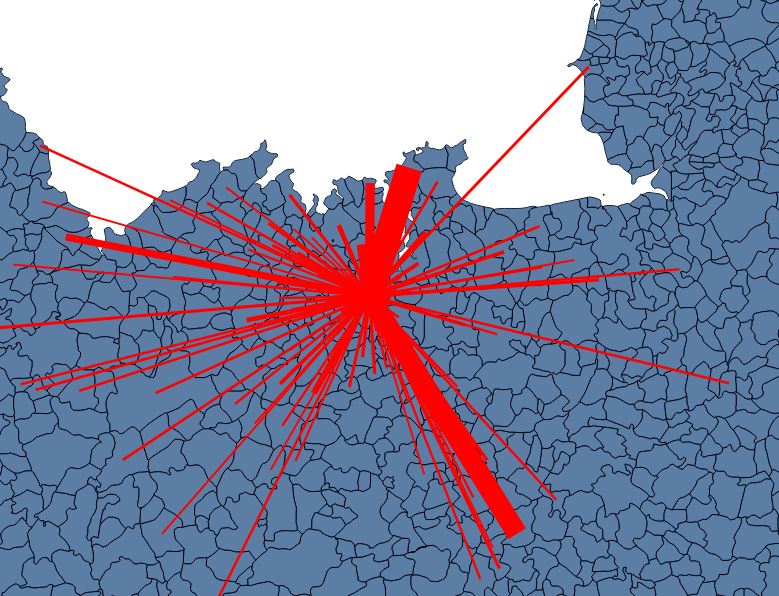
When zoomed on the hub

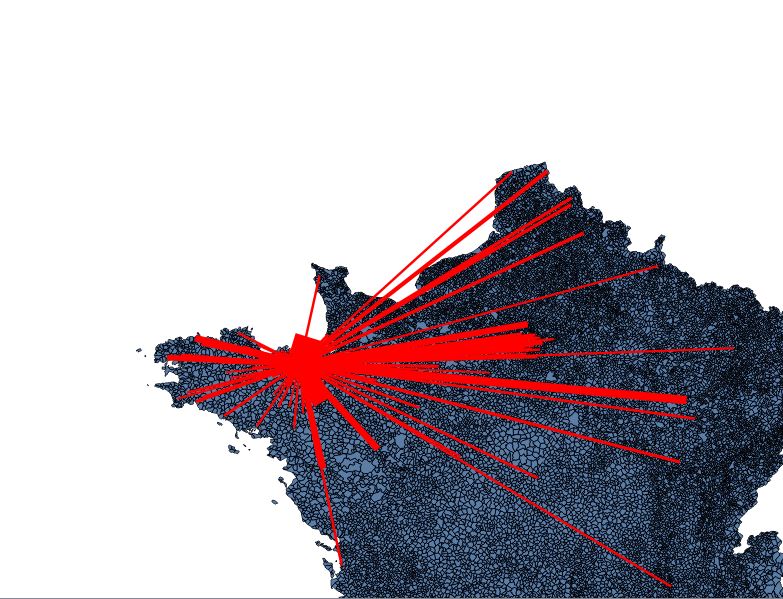
When unzoomed

I would like to have all my lines appearing, even when zoomed on the hub.

8
  • This won't be helpful...but I get the same issue with Underdark's flow mapping approach. It must be something about the way dense geometry is rendered ... only suggestion is to play with the attribute width for the local level map... make the widths smaller? Commented Nov 14, 2017 at 19:24
  • May be you can upload your data (shp...) in order to be able to replicate your steps and try to get an answer. Commented Nov 21, 2017 at 16:22
  • 1
    Shapefile comes from here : IGN and the joined table from INSEE Commented Nov 22, 2017 at 17:44
  • Maybe segmenting the line could be a hack to make it appear on the map, if lines are only showed ib both of the ends are close to the map extent. Grass-tool 'v.split.length' maybe does the job.
    – Julian
    Commented Dec 14, 2017 at 12:48
  • 1
    Is this the same problem as I've had (if it is it gives a simple way to understand this issue - if not, ignore me): I wanted to show a point dataset with the whole set of generated points shifted 300km east and 600km north in comparison to the actual points. It works - but only when zoomed out so that the original points are within the map canvas. As soon as you zoom to the set of generated points (moving the actual point locations outside the canvas) the generated points vanish. (QGIS 2.14) Commented Jan 12, 2018 at 14:14

2 Answers 2

4

Found the following work-around: Use a additional virtual layer instead of a geometry generator to display the lines.

Definition of the virtual layer:

select m.FID, make_line(.....) as geometry from my_layer m

(original geometry can be referenced using m.geometry)

To assure the virtual layer refreshes when my_layer is edited, go to layer properties | dependencies and make sure my_layer is checked (which is greyed out by default).

3

The problem here is that there's no actual data saying "there's a line here". Your expression is part of the Layer Styling, and is only encountered in the rendering process when two applicable points are also being rendered.

Try using the Distance to nearest hub tool, found in the processing toolbox under Vector analysis tools. I note that you're selecting particular polygons for your spokes, and styling the lines according to other attributes. This is possible, but you'll need to do a few things to prep for it. Thankfully, the tool automatically uses centroids when polygon inputs are chosen.

  1. Vector selections tools > Extract by attribute
    • Input layer: 'LAYER_1'
    • Selection attribute: 'ATTRIBUTE_1'
    • Operator: =
    • Value: 'value referring to hub polygon'
    • Extracted (attribute): 'HUB'

  2. Vector selections tools > Extract by attribute
    • Input layer: 'LAYER_1'
    • Selection attribute: 'ATTRIBUTE_2'
    • Operator: chosen as needed
    • Value: 'value(s) referring to spoke polygons'
    • Extracted (attribute): 'SPOKES'

  3. Vector analysis tools > Distance to nearest hub
    • Source points layer: 'SPOKES'
    • Destination hubs layer: 'HUB'
    • Hub layer name attribute: creates a "Hub Name" field in the output based on the attribute chosen, in case multiple hubs are specified in input layer
    • Output shape type: Line to hub
    • Measurement unit: Meters
    • Hub distance: 'OUTPUT_LAYER_NAME'

The resulting output retains all attributes of the 'SPOKES' layer input, so attributes needed for line styling will still be present. As its own vector layer, the lines will remain visible at all zoom levels, regardless of the visibility of either endpoint.

If you're comfortable with the Graphical Modeler, you might even build these steps into a single process so as not to clutter your workspace with unnecessary layers.

Your Answer

By clicking “Post Your Answer”, you agree to our terms of service and acknowledge you have read our privacy policy.

Not the answer you're looking for? Browse other questions tagged or ask your own question.