13

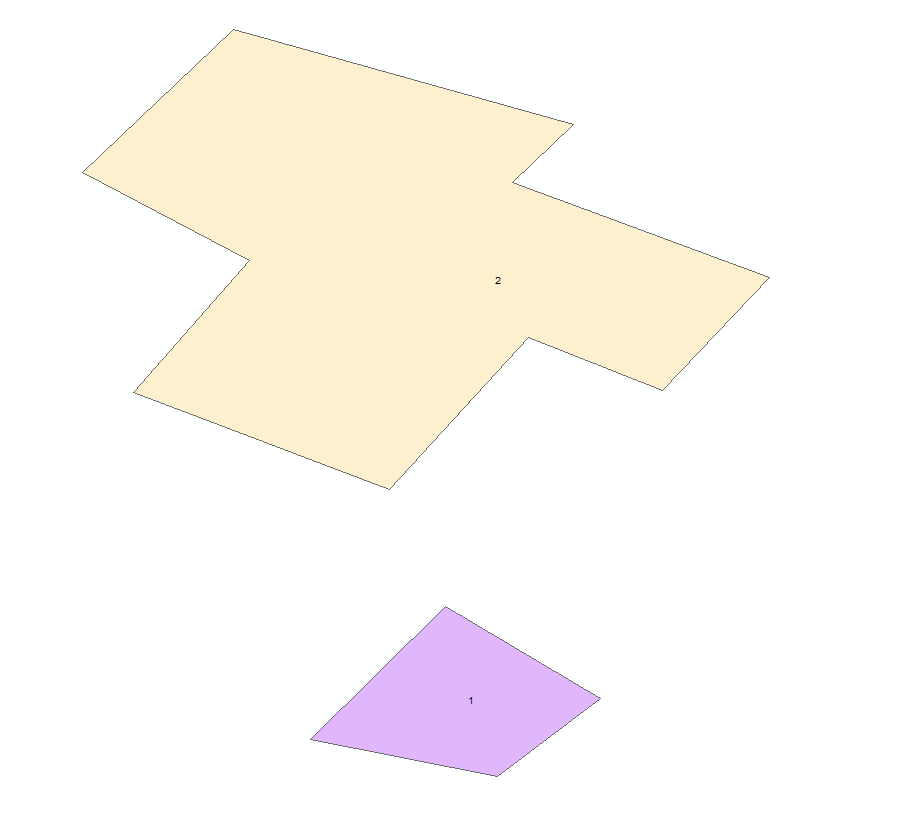
Goal is to group polygon (1,2,4) and polygon (3) based on overlap. All polygons are part of the same shapefile layer.

enter image description here

In ArcMap I can simply do dissolve and uncheck Create multipart features.

enter image description here

However dissolve in geopandas requires you to set an attribute to dissolve on. What would be the easiest alternative in geopandas?

3 Answers 3

15

Using this example GeoSeries:

s = geopandas.GeoSeries([Polygon([(0, 0), (0, 2), (2, 2), (2, 0)]), Polygon([(0, 1), (0, 3), (2, 3), (2, 1)]),Polygon([(1, 0), (1, 2), (3, 2), (3, 0)]), Polygon([(4, 4), (4, 6), (6, 6), (6, 4)])])

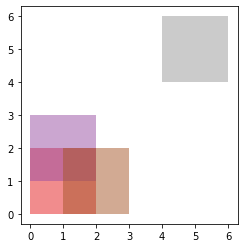
s.plot(alpha=0.5, cmap='Set1')

enter image description here

We could create a matrix indicating which geometries are overlapping:

In [55]: overlap_matrix = s.apply(lambda x: s.overlaps(x)).values.astype(int)

In [56]: overlap_matrix
Out[56]: 
array([[0, 1, 1, 0],
       [1, 0, 1, 0],
       [1, 1, 0, 0],
       [0, 0, 0, 0]])

And from that get the groups using scipy's connected components:

In [57]: from scipy.sparse.csgraph import connected_components

In [58]: connected_components(overlap_matrix)
Out[58]: (2, array([0, 0, 0, 1], dtype=int32))

In [59]: n, ids = connected_components(overlap_matrix)

And use dissolve based on those groups:

In [60]: df = geopandas.GeoDataFrame({'geometry': s, 'group': ids})

In [61]: res = df.dissolve(by='group')

In [62]: res
Out[62]: 
                                                geometry
group                                                   
0      POLYGON ((0 0, 0 1, 0 2, 0 3, 2 3, 2 2, 3 2, 3...
1                    POLYGON ((4 4, 4 6, 6 6, 6 4, 4 4))

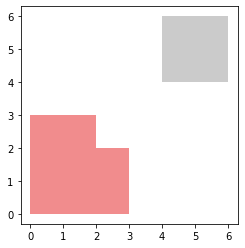
In [63]: res.plot(cmap='Set1')
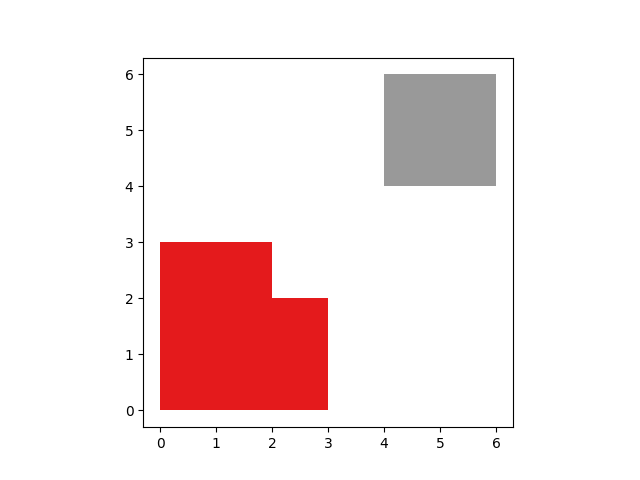
enter image description here

But note: I am certainly not sure if creating such a matrix is the most efficient way.
Further note, this would actually be a nice enhancement to geopandas to enable this somehow (or at least to have a good solution in the examples)

2
  • This outputs incorrect results if a starting polygon is entirely within another.
    – zabop
    Commented Sep 12, 2022 at 12:49
  • To redeem this, I suggest using intersects instead of overlaps.
    – zabop
    Commented Sep 12, 2022 at 12:54
10

I found a workaround:

def explode(gdf):
    """    
    Will explode the geodataframe's muti-part geometries into single 
    geometries. Each row containing a multi-part geometry will be split into
    multiple rows with single geometries, thereby increasing the vertical size
    of the geodataframe. The index of the input geodataframe is no longer
    unique and is replaced with a multi-index. 

    The output geodataframe has an index based on two columns (multi-index) 
    i.e. 'level_0' (index of input geodataframe) and 'level_1' which is a new
    zero-based index for each single part geometry per multi-part geometry

    Args:
        gdf (gpd.GeoDataFrame) : input geodataframe with multi-geometries

    Returns:
        gdf (gpd.GeoDataFrame) : exploded geodataframe with each single 
                                 geometry as a separate entry in the 
                                 geodataframe. The GeoDataFrame has a multi-
                                 index set to columns level_0 and level_1

    """
    gs = gdf.explode()
    gdf2 = gs.reset_index().rename(columns={0: 'geometry'})
    gdf_out = gdf2.merge(gdf.drop('geometry', axis=1), left_on='level_0', right_index=True)
    gdf_out = gdf_out.set_index(['level_0', 'level_1']).set_geometry('geometry')
    gdf_out.crs = gdf.crs
    return gdf_out

df_all = df1.append(df2,ignore_index=True)
df_all["group"] = 1
dissolved = df_all.dissolve(by="group")
gdf_out = explode(dissolved)
gdf_out2 = gdf_out.reset_index()

Notebook with the workaround (different polygons):

4
  • 1
    What is df1 and df2 here? As you mention you have a single shapefile with those polygons?
    – joris
    Commented Feb 16, 2018 at 17:24
  • 1
    Ah, I understand what you are doing (apart from the append). This is indeed a nice solution, and if you just care about overlap, much simpler than mine!
    – joris
    Commented Feb 16, 2018 at 17:33
  • You are right, for python testing I used geopandas.org/… instead of my shapefile. I used df1 and df2 from the docs and appended them to create something similar to the one-layer shapefile.
    – RutgerH
    Commented Feb 16, 2018 at 17:47
  • btw, I enjoy geopandas a lot, thank you for the hard work Joris
    – RutgerH
    Commented Feb 16, 2018 at 17:48
2

I've tried to enhance @joris's answer

from shapely.geometry import Polygon 
import geopandas as gpd 

s = gpd.GeoDataFrame(data=[1, 2, 3, 4], 
geometry=[Polygon([(0, 0), (0, 2), (2, 2), (2, 0)]),
          Polygon([(0, 1), (0, 3), (2, 3), (2, 1)]),
          Polygon([(1, 0), (1, 2), (3, 2), (3, 0)]), 
          Polygon([(4, 4), (4, 6), (6, 6), (6, 4)])], 
                     columns=['column'])

   column                                           geometry
0       1  POLYGON ((0.00000 0.00000, 0.00000 2.00000, 2....
1       2  POLYGON ((0.00000 1.00000, 0.00000 3.00000, 2....
2       3  POLYGON ((1.00000 0.00000, 1.00000 2.00000, 3....
3       4  POLYGON ((4.00000 4.00000, 4.00000 6.00000, 6....

s.plot(alpha=0.5, cmap='Set1')

enter image description here

s_ = gpd.GeoDataFrame(
  geometry=[s.unary_union]).explode(
  index_parts=False).reset_index(
  drop=True)

s_.plot(alpha=0.5, cmap='Set1')

enter image description here

If you need to work with data you can use sjoin and dissolve functions.

s_ = gpd.sjoin(s_, s, how='left').drop(columns=['index_right'])
s_.dissolve(s_.index, aggfunc='first')

geometry    column
0   POLYGON ((3.00000 0.00000, 2.00000 0.00000, 1....   1
1   POLYGON ((6.00000 6.00000, 6.00000 4.00000, 4....   4

Your Answer

By clicking “Post Your Answer”, you agree to our terms of service and acknowledge you have read our privacy policy.

Not the answer you're looking for? Browse other questions tagged or ask your own question.