I'm attempting to streamline the process of importing polygons (19 in this case) from a website into QGIS. I extracted the JSON using chrome's dev tools and converted it into CSV spreadsheet here. The screenshot below taken from the csv file is structured in such a way that each feature is contained to a single row. Nodes are listed in columns with eastings followed by northings. Critically, there is an ordering to the nodes as indicated by the column headers. Eastings and northings are denoted with a 0 and 1 at the end respectively. The centre number increments up by one with each pair of eastings/northings.
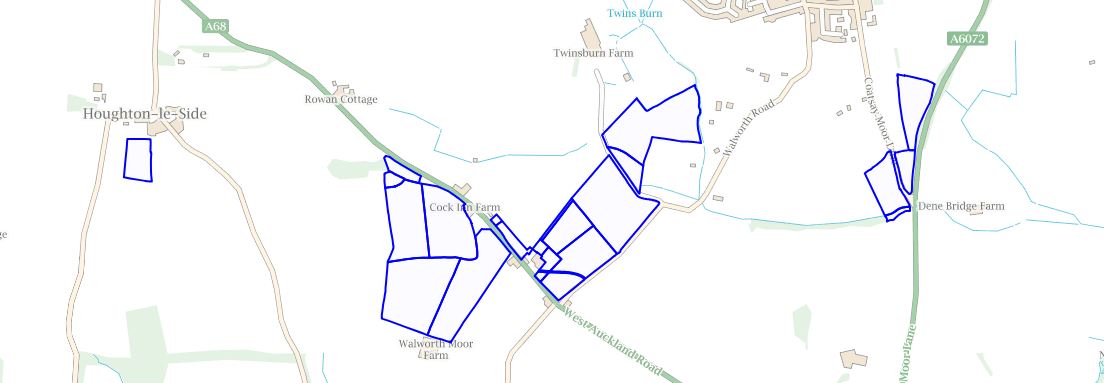
Is there a way to input the data into QGIS with python that will plot each node in the correct order and then use points to path followed with lines to polygons? The end result should look like the screenshot taken from the website below.


