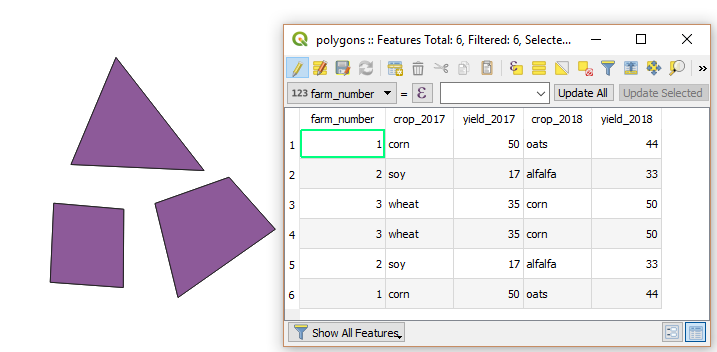
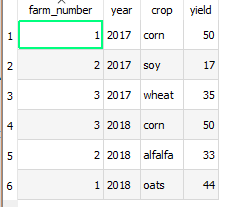
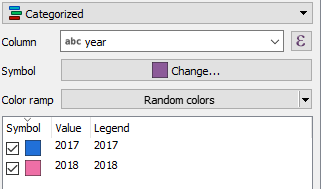
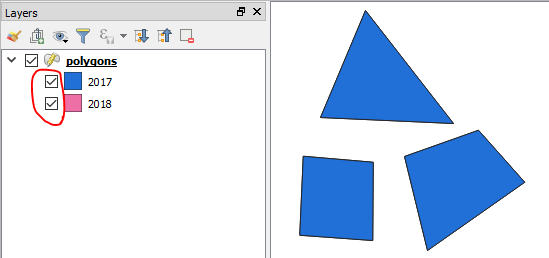
I have a Layer with polygons; for each polygon there are different datasets for the last 3 years. Every year some of the data changed, e.g. what was grown on the field, etc. It would be great if I had a tab for every year so I could switch between them and compare them. At the moment it is shown among each other and pretty chaotic.
I can split this dataset in single layers if it helps, so I can either have 1 Layer with all the data or 3 with different data. They all have the same attributes just with other values, only the id for all polygons representing the same area is the same.
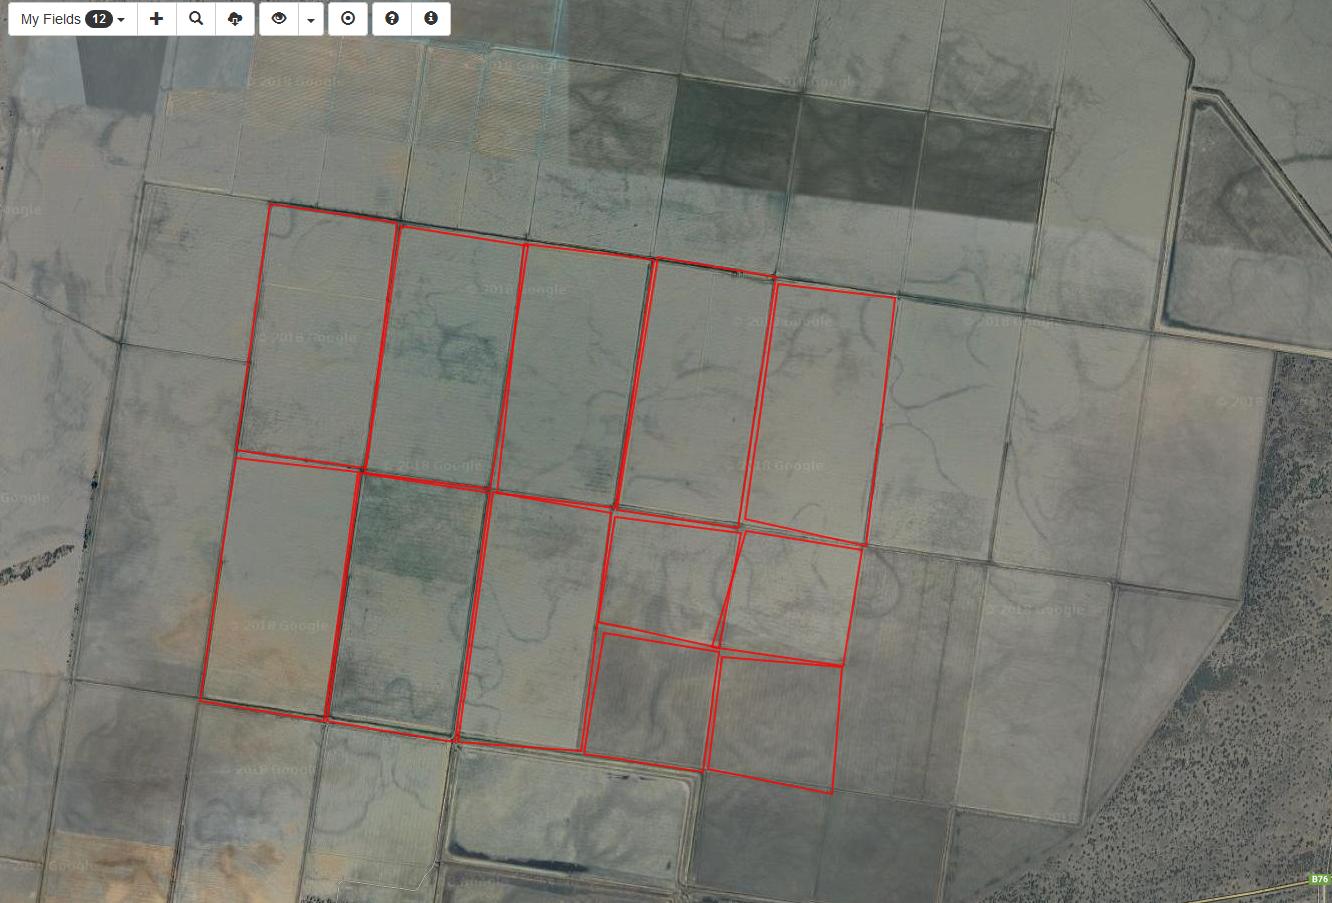
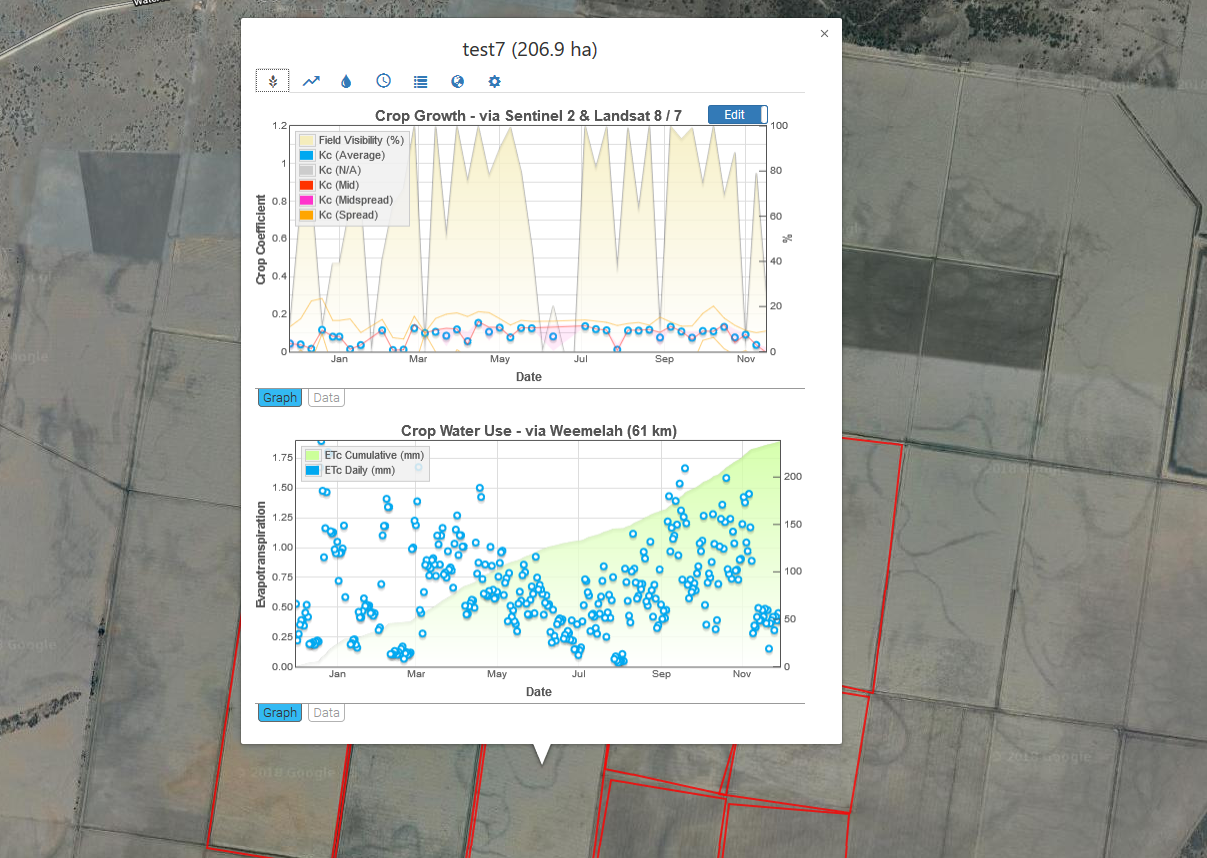
The answer is not fitting for me because i have over 900.000 entrys in my attribute table for each year. Besides i want to add data over the years so i need to automate the process. My plan so far was that i can upgrade the database in postgis and just add it as a layer in qgis. I found something close to what i am looking for at irriSAT. I will post a picture here. The red polygons are the entrys i have. For each field i have different data. If i click the polygon i want some kind of tab with the data displayed shown up where i can select the different years. I know this is really specific but that would be perfect.
First picture would be my qgis display (the red outlining doesnt need to be displayed).
Second picture would be the window that opens if i click one of the polygons wich contains data. I dont need any of these fancy graphics just my plain data. It would be great if i could tab or select the year i want to show somewhere in this window

