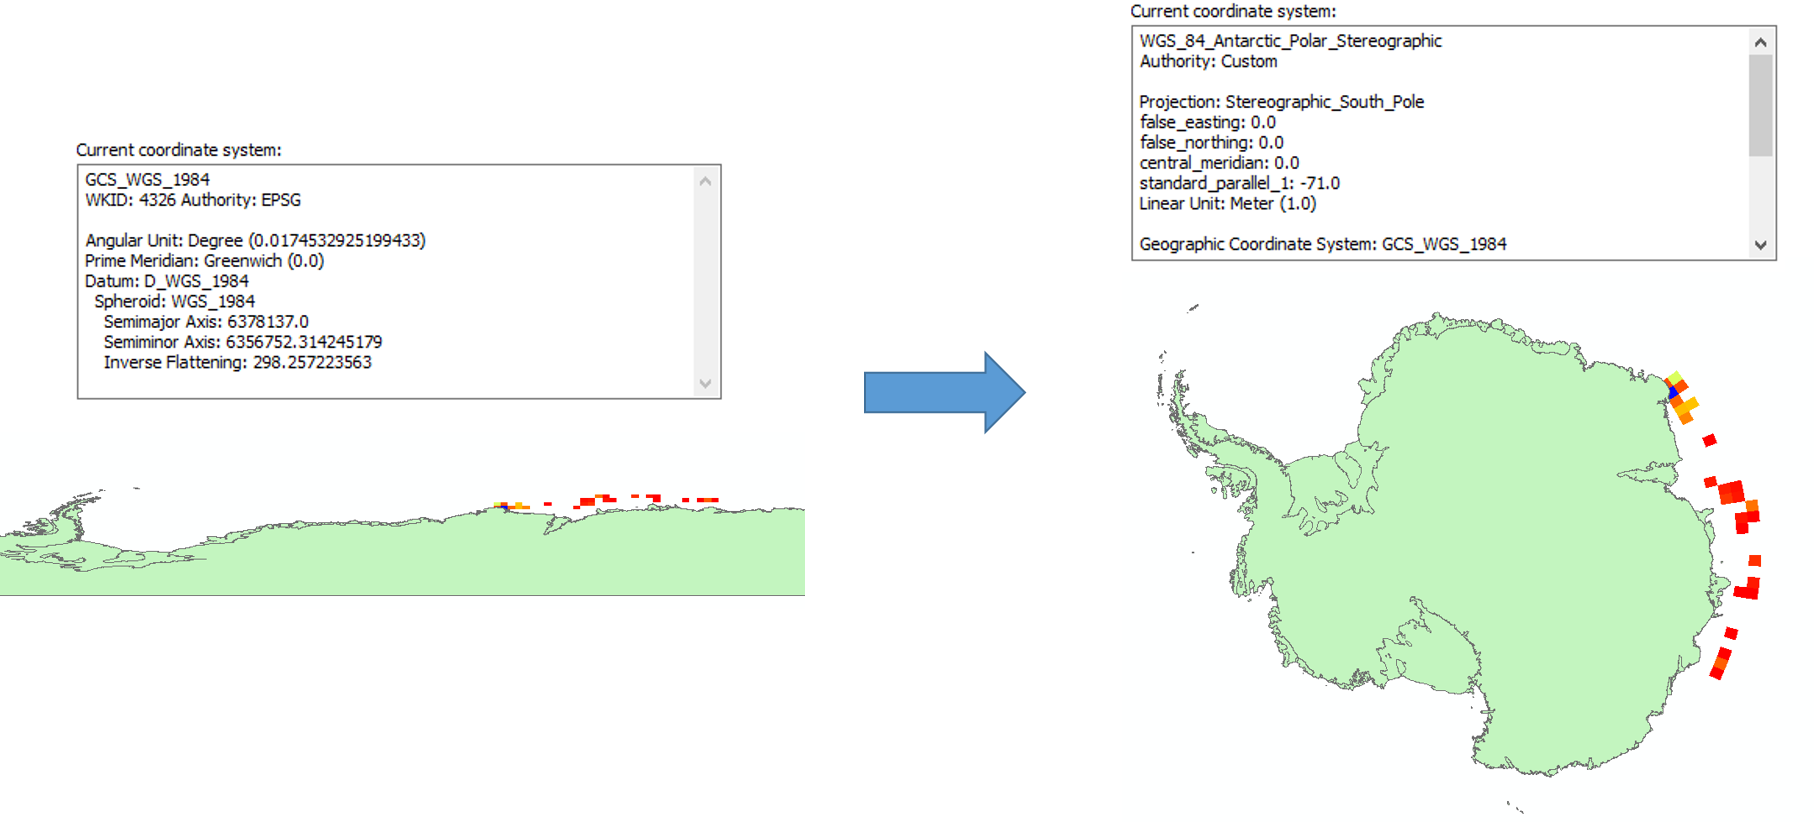
Desired output: Raster with original characteristics but in transformed projection using R (I.e. See second paragraph here.). NB, I need to do this for 100s of different rasters.
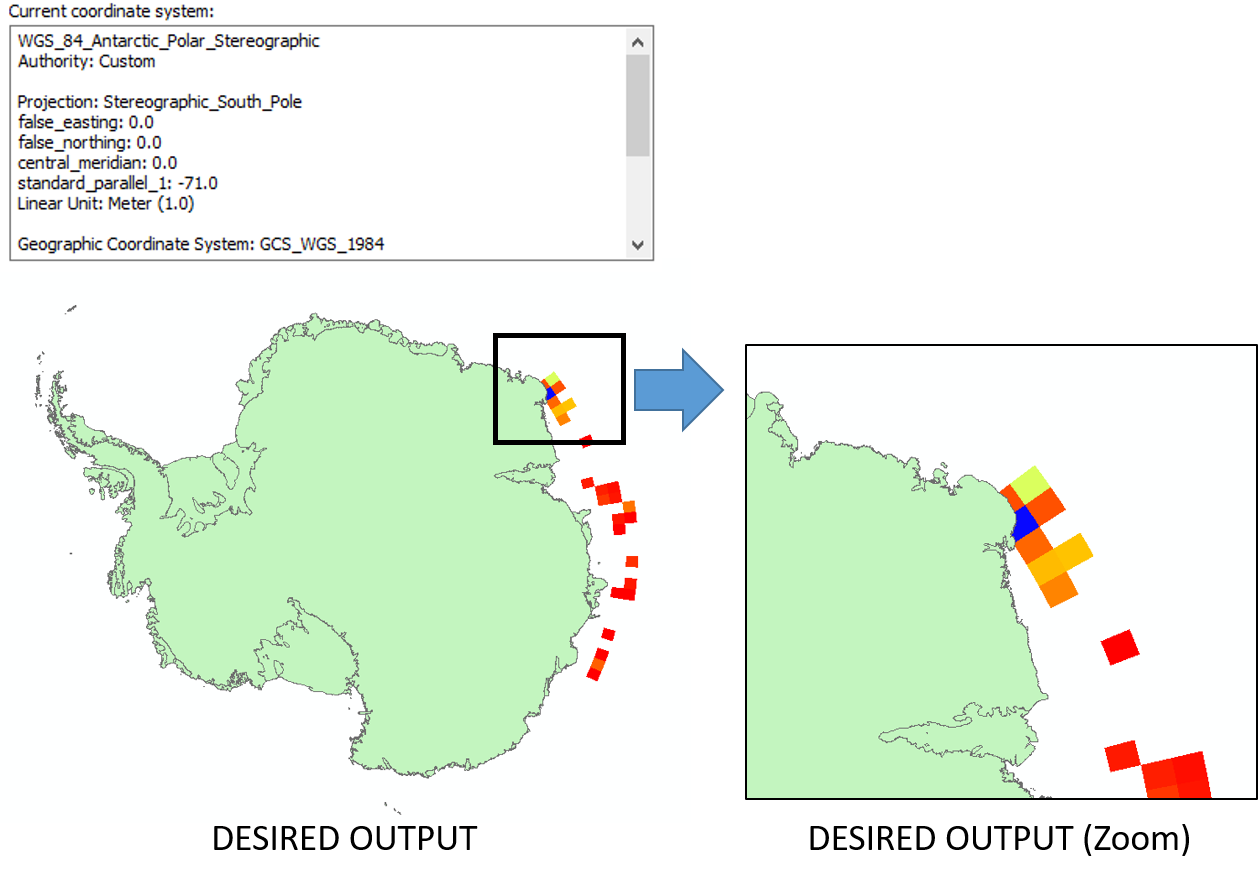
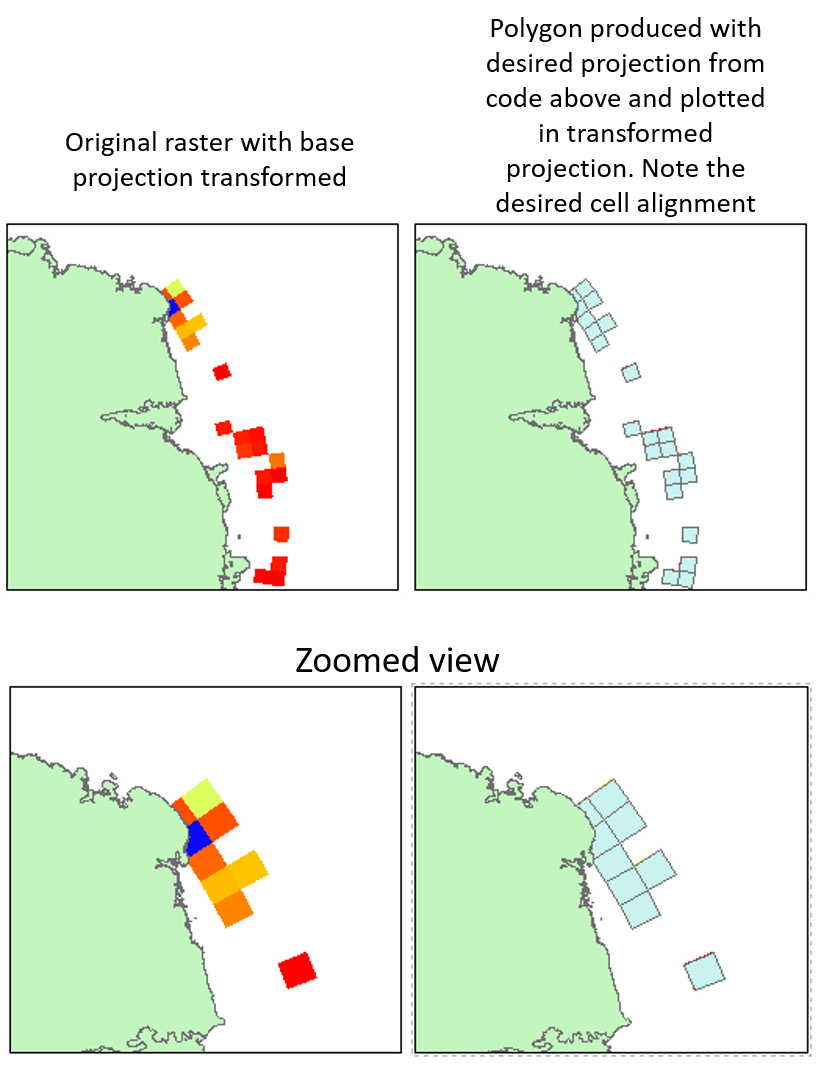
You can achieve this in ArcMap for a single raster doing the following. 1. Load original raster. 2. Right-click background of data frame and change coordinate system to new desired coordinate system (see figure below). Panel on the left shows original raster with cell dimensions (1 deg long by 2 deg lat). Panel on the right shows desired output, where the overall map projection has been updated and cell dimensions of raster have been preserved.
To achieve this in R, all roads point me toward using the function: projectRaster.
Where I have specified the following (r_toconvert = the raster I wish to convert; Shp_with_desired_projection = the shapefile with my desired projection):
r.new <- projectRaster(r_toconvert, crs=CRS(projection(Shp_with_desired_projection)), method = "bilinear")
Note: my original raster is in projection:
+proj=longlat +datum=WGS84 +no_defs +ellps=WGS84 +towgs84=0,0,0
And the desired projection for display purposes I'd like to be:
+proj=stere +lat_0=-90 +lat_ts=-71 +lon_0=0 +k=1 +x_0=0 +y_0=0 +datum=WGS84 +units=m +no_defs +ellps=WGS84 +towgs84=0,0,0
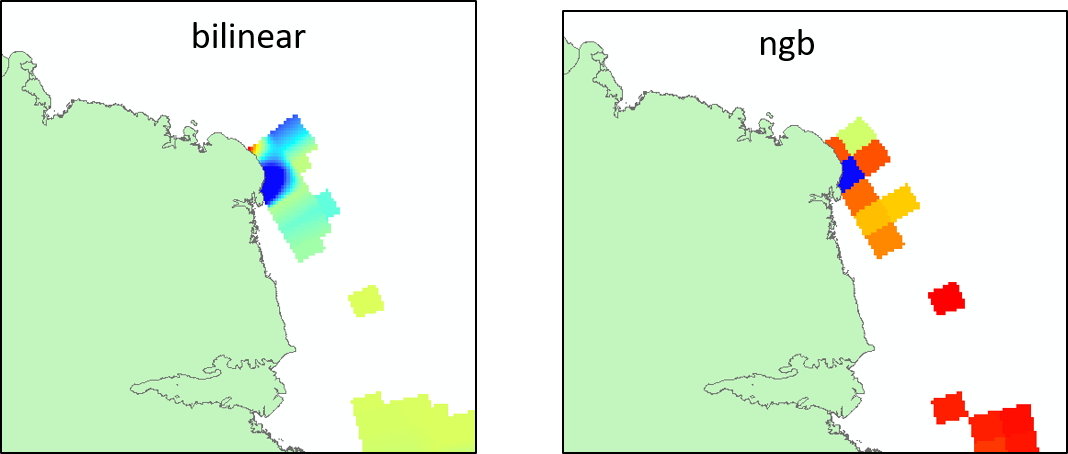
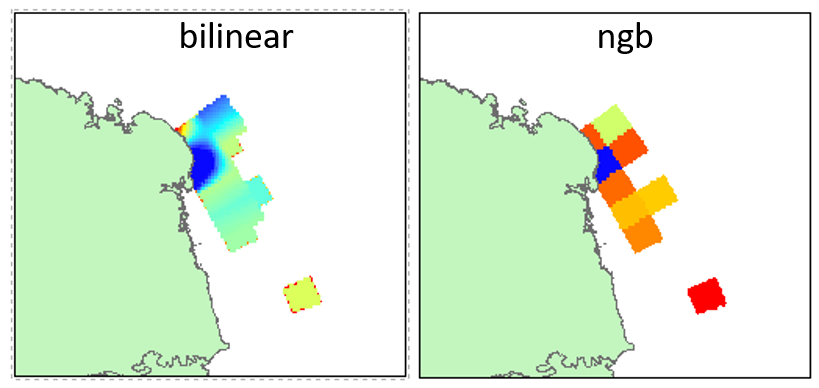
However, when using projectRaster I produce rasters that do not preserve the same characteristics as my original raster (plotted in ArcMap for ease of exploration).
What I would like to achieve:
But what I actually end up achieving using projectRaster and trying both methods:
This seems to be somewhat non-trivial based on the ways rasters require re-projection (as outlined here section 6.6)
However, it clearly seems to be possible to preserve the original raster's characteristics (as evident above and in the ESRI webpage linked above) and plot with a new transformation.
WHAT HAVE I TRIED:
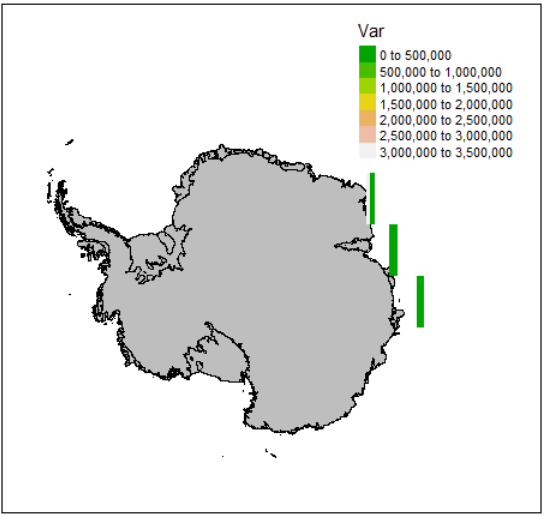
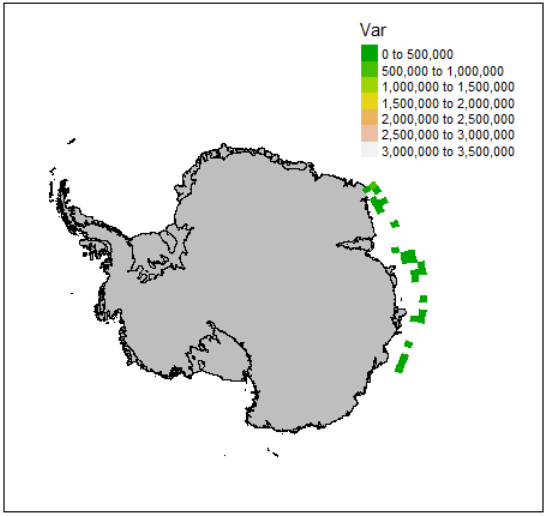
tmap package (which can also project on the fly):
tm_shape(antarctica, is.master = T)+ # Set is.master to specify this is the master projection
  tm_borders(col="black")+
  tm_polygons(col="grey")+
  tm_shape(r_toconvert)+ # My original raster
  tm_raster("Var", palette = terrain.colors(10))
Where the output is far from ideal:
The output is improved upon when using the new raster following projecRaster, and having the method set to ngb (method set to ngb does not seem to be the correct thing to do for a continuous variable though...):
r.new <- projectRaster(r_toconvert, crs=CRS(projection(antarctica)), method = "ngb")
tm_shape(antarctica, is.master = T)+ # Set is.master to specify this is the master projection
  tm_borders(col="black")+
  tm_polygons(col="grey")+
  tm_shape(r.new)+ # My original raster
  tm_raster("Var", palette = terrain.colors(10))
But there still appears to be the same issue with new raster now losing characteristics of original raster (hence the jagged cell shapes above).
I've also played with some R base plot options, and looked in the SOmap package currently in development
I seek an R solution.

