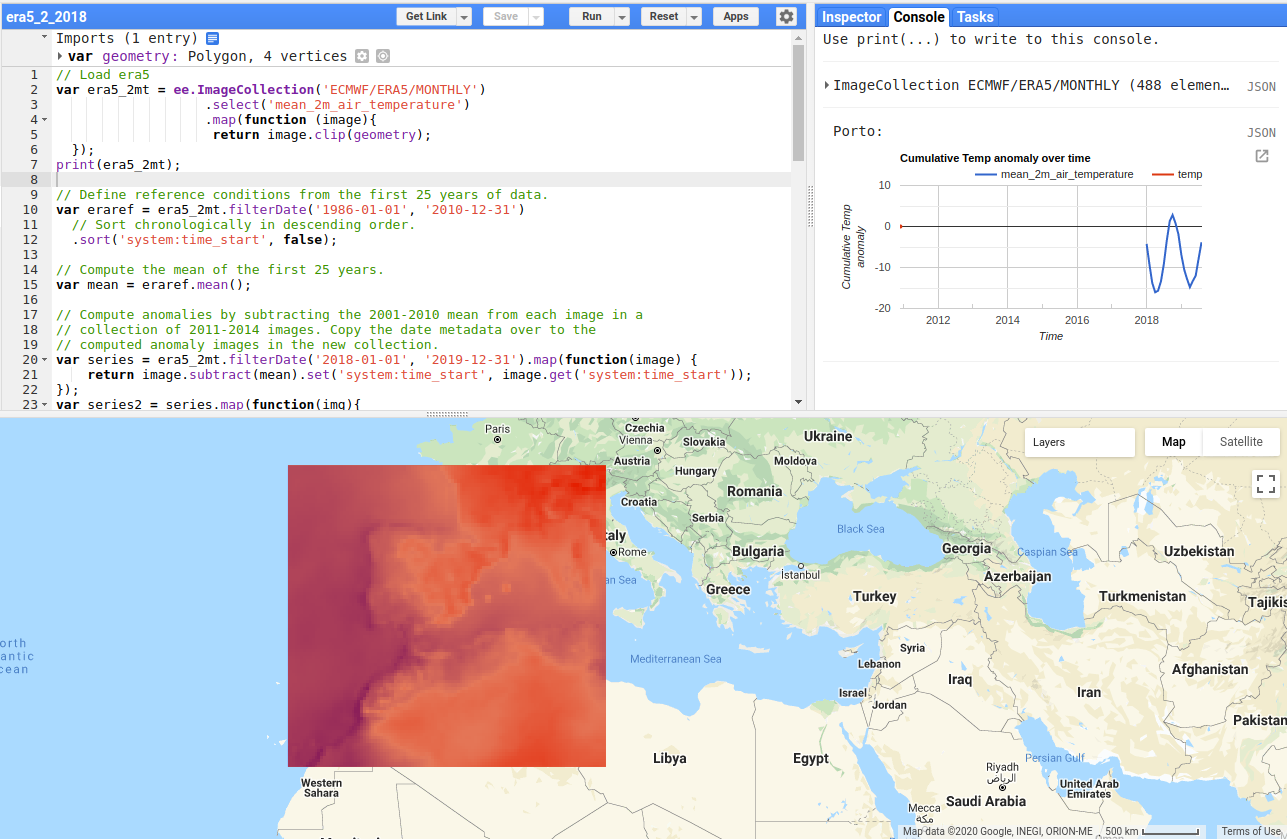
I am trying to calculate in Google Earth Engine using ERA5 the monthly 2mt temperature anomalies from January to December 2018 compared to the long-term reference period of 1981-2010. In other words, I would like to compare the temp anomaly of January 2018 with January of the long-term period. Finally, I would like to create a and create a time-lapse video from January to December 2018. As a starting point, I am using the "Iterating over an ImageCollection" code example, but I don't get it working properly with the ERA5 data.
link to the code and the code.
// Load era5
var era5_2mt = ee.ImageCollection('ECMWF/ERA5/MONTHLY')
               .select('mean_2m_air_temperature')
               .map(function (image){
                return image.clip(geometry);
  });
print(era5_2mt);

// Define reference conditions from the first 30 years of data.
var eraref = era5_2mt.filterDate('1980-01-01', '2010-12-31')
  // Sort chronologically in descending order.
.sort('system:time_start', false);

// Compute the mean of the first 30 years.
var mean = eraref.mean();

// Compute anomalies by subtracting the 1980-2010 mean from each image
in a
// collection of 2018 images. Copy the date metadata over to the
// computed anomaly images in the new collection.
var series = era5_2mt.filterDate('2018-01-01', '2018-12-
31').map(function(image) {
    return image.subtract(mean).set('system:time_start',
image.get('system:time_start'));
});
var series2 = series.map(function(img){
    return img.clip(geometry);
});


// Display cumulative anomalies.
Map.setCenter(-4.12, 39.834, 5);
Map.addLayer(series.sum(),
    {min: -50, max: 50, palette: ['blue','white','red']}, 'Temp 2mt
anomaly');

// Get the timestamp from the most recent image in the reference
collection.
var time0 = eraref.first().get('system:time_start');

// Use imageCollection.iterate() to make a collection of cumulative
anomaly over time.
// The initial value for iterate() is a list of anomaly images already
processed.
// The first anomaly image in the list is just 0, with the time0
timestamp.
var first = ee.List([
// Rename the first band 'temp'.
  ee.Image(0).set('system:time_start', time0).select([0], ['temp'])
]);

// This is a function to pass to Iterate().
// As anomaly images are computed, add them to the list.
var accumulate = function(image, list) {
 // Get the latest cumulative anomaly image from the end of the list
with
  // get(-1).  Since the type of the list argument to the function is
unknown,
  // it needs to be cast to a List.  Since the return type of get() is
unknown,
  // cast it to Image.
  var previous = ee.Image(ee.List(list).get(-1));
  // Add the current anomaly to make a new cumulative anomaly image.
  var added = image.add(previous)
    // Propagate metadata to the new image.
    .set('system:time_start', image.get('system:time_start'));
  // Return the list with the cumulative anomaly inserted.
  return ee.List(list).add(added);
};

// Create an ImageCollection of cumulative anomaly images by
iterating.
// Since the return type of iterate is unknown, it needs to be cast to
a List.
var cumulative = ee.ImageCollection(ee.List(series.iterate(accumulate,
first)));

// Predefine the chart titles.
var title = {
  title: 'Cumulative Temp anomaly over time',
  hAxis: {title: 'Time'},
  vAxis: {title: 'Cumulative Temp anomaly'},
};

// Chart some interesting locations.
//var pt1 = ee.Geometry.Point(-8.669, 41.187);
//print('Porto:',
//Chart.image.series(cumulative, pt1, ee.Reducer.first(),
500).setOptions(title));

