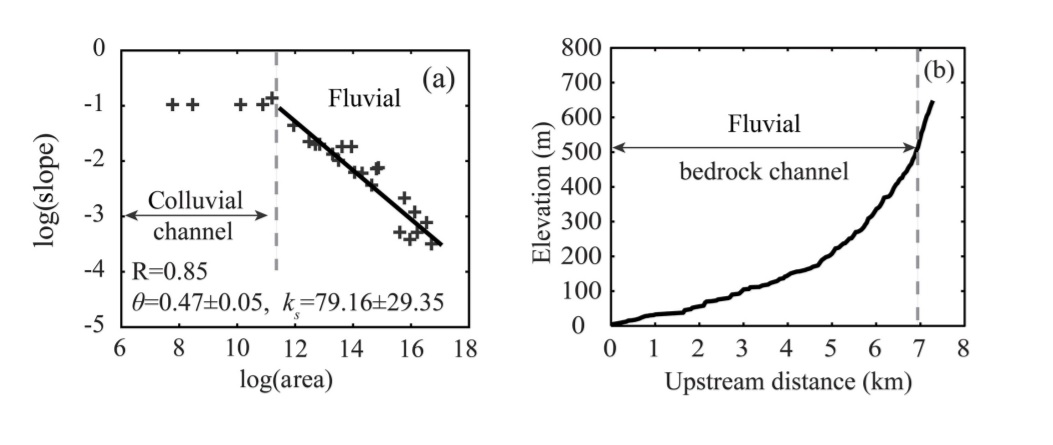
I am doing hydrological analysis for a river network in a DTM. I have produced a graph like (b). Now, I want to take it one step further and plot a log slope-area graph like graph (a).
How do I calculate slope and area for the catchment? I assume the (+) on the graph show slope of diferent rivers? If so, how do I calculate the slope from the DTM?
I am working with ArcGIS Pro latest version and MATLAB.

