7

I'm trying to calculate the time of concentration for every point along a stream network. To calculate the time of concentration, I need the upstream channel length and channel slope.

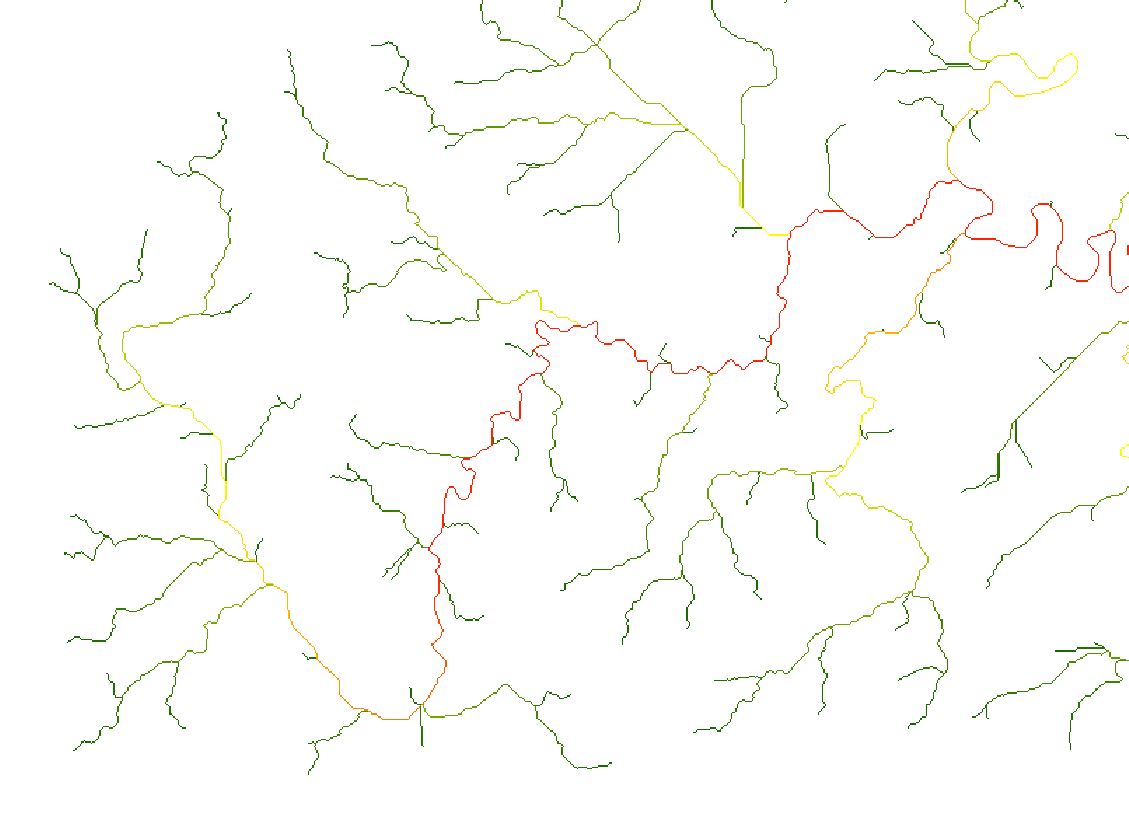
I've been able to calculate the upstream channel length at each pixel using the Hydrology/Flow Length (upstream) tool (See image - red corresponds to longer cumulative channel length):

Upstream channel length

However, I have not been able to estimate the overall channel slope at each pixel (i.e. the slope between the pixel in question to the furthest-upstream headwater pixel). I know you can do this for individual basins (i.e. for one pixel), but my study area is very large (longest channel is 500+ km), so I dont want to generate a "watershed" for every single stream pixel, as this will be too time consuming.

I have also tried calculating the flow length with a slope raster as the "input weight raster," (and then dividing the result by the flow length raster (with no weight raster) to get the average slope along the stream, but this is far overestimating the overall stream slope.

Essentially, I need to find a way to make a map of the headwater elevation corresponding to any pixel in the stream network. Then I can subtract the elevation at each pixel and divide by the upstream channel length to get the overall stream slope.

(I'm using ArcGIS 10.1, Basic License)


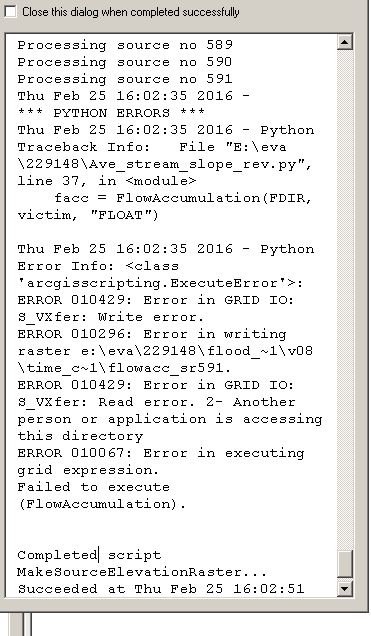
Here is the error message I'm getting when I use the python script presented below (after running for 1 hour and getting through half of the points):

error message

3
  • What is the resolution per pixel?
    – whyzar
    Commented Feb 23, 2016 at 15:31
  • 92.7 meters - the entire DEM I'm working with is 4201 x 2367 pixels, but we're hoping to scale this analysis up to a 30 m grid once the tools are working...
    – Nena
    Commented Feb 23, 2016 at 15:43
  • Your new question should be asked as a new question.
    – PolyGeo
    Commented Feb 8, 2018 at 22:49

3 Answers 3

9

As @Hornbydd pointed it is network searching problem. I suggest the following workflow:

  1. find source points of the streams
  2. sort them in descending order by flow length

In the picture below 139 green points are sources labelled by their sequential order and elevation, e.g. remotest point (1/435).
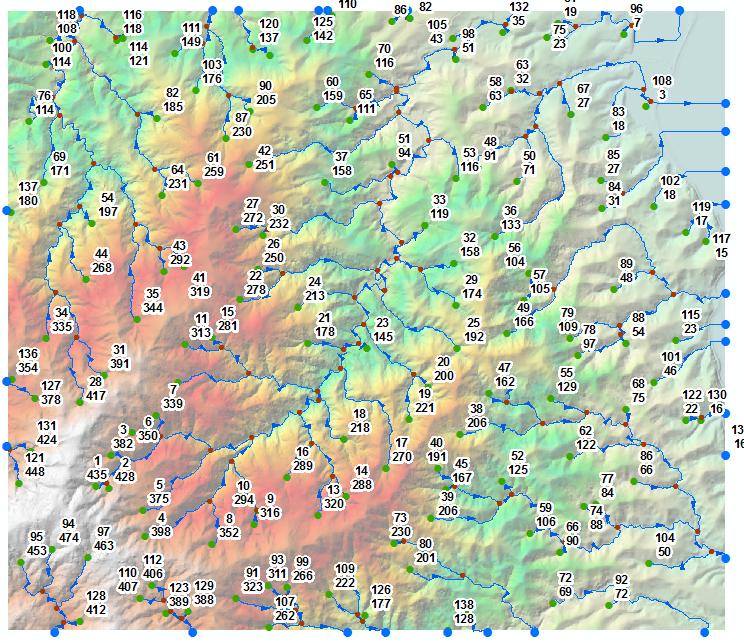
Screen shot

There are 2 possible paths from here:

  • Trace and dissolve streams downstream from each source node, to calculate what I call ‘long rivers’
  • Spatially join (intersect) stream points that represent your streams (one to many) to long rivers
  • Select points with minimum long river ID and add to points table relevant elevation.

This is pretty much or close to what @Hornbydd is suggesting.

Alternatively run flow accumulation multiple times for each point (139 in my example), using its sequential number as weight raster.

Use cell statistics to compute minimum. This will give source point ID etc

UPDATE:

I’ll elaborate on raster approach because network searching is boring.

  1. Use Stream to Feature (do not simplify lines) to convert stream raster to polylines. If in doubt re sources location, use stream order tool. First point of stream orders 1 is source.
  2. Convert starts of (selected) polylines to points.
  3. Extract multi-values to points from Flow Length and DEM rasters.

Sort points using Flow Length field in descending order, output to SHAPEFILE, call this layer “SOURCES” in current mxd. It’s table should look like this:
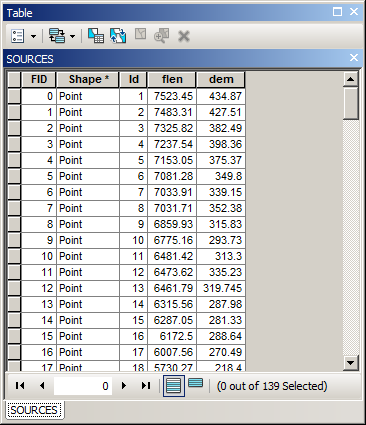
Screen shot

Add flow direction raster to mxd and call it “FDIR”

Set environment extent equal FDIR extent, raster analysis cell size to one in FDIR.

Modify output folder and output grid name in below script and run it from mxd.

import arcpy, os, traceback, sys
from arcpy import env
from arcpy.sa import *

env.overwriteOutput = True
outFolder=r"D:\SCRATCH\GRIDS"
outGrid=r"fromELEV"
env.workspace = outFolder
try:
    def showPyMessage():
        arcpy.AddMessage(str(time.ctime()) + " - " + message)

    mxd = arcpy.mapping.MapDocument("CURRENT")
    SOURCES=arcpy.mapping.ListLayers(mxd,"SOURCES")[0]
    FDIR=arcpy.mapping.ListLayers(mxd,"FDIR")[0]
    SOURCES.definitionQuery=""

    aTable=arcpy.da.TableToNumPyArray(SOURCES,("ID","DEM"))
    victim ='VICTIM'
    fd=arcpy.Raster(FDIR.name)
    one=Con(fd>0,0)

    for ID,Z in aTable:
        arcpy.AddMessage('Processing source no %s' %ID)
        dq='"ID"=%s' %ID
        SOURCES.definitionQuery=dq
        arcpy.PointToRaster_conversion(SOURCES, "DEM", victim)
        facc = FlowAccumulation(FDIR, victim, "FLOAT")
        two=Con(one==0,facc,one)
        one=two
#    REMOVE LINE BELOW AFTER TESTING
        if ID==10:break

    SOURCES.definitionQuery=""
    two=Con(one!=0,one)
    two.save(outGrid)
    arcpy.Delete_management(victim)

except:
    message = "\n*** PYTHON ERRORS *** "; showPyMessage()
    message = "Python Traceback Info: " + traceback.format_tb(sys.exc_info()[2])[0]; showPyMessage()
    message = "Python Error Info: " +  str(sys.exc_type)+ ": " + str(sys.exc_value) + "\n"; showPyMessage()        

OUTPUT: Note sources labelled by ID,flow length and elevation. After processing last source it will take some time for script to finish! I guess it is ArcGIS removing all temporary rasters created during the run.
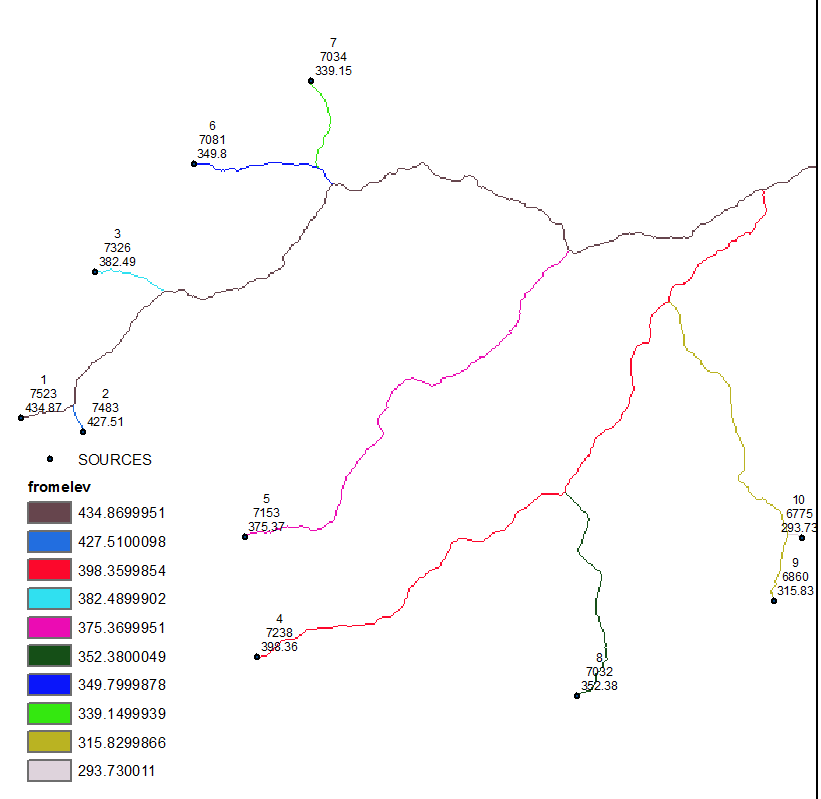
enter image description here

UPDATE 2 hopefully last

My bad, try this out. It is much faster:

import arcpy, os, traceback, sys
from arcpy import env
from arcpy.sa import *

env.overwriteOutput = True
outFolder=r"D:\SCRATCH\GRIDS"
outGrid=r"fromELEV"
env.workspace = outFolder
NODATA=-9999.0
try:
    def showPyMessage():
        arcpy.AddMessage(str(time.ctime()) + " - " + message)

    mxd = arcpy.mapping.MapDocument("CURRENT")
    SOURCES=arcpy.mapping.ListLayers(mxd,"SOURCES")[0]
    FDIR=arcpy.mapping.ListLayers(mxd,"FDIR")[0]
    fd=arcpy.Raster(FDIR.name)
    one=Con(fd>0,NODATA)
    dirArray = arcpy.RasterToNumPyArray(fd,"","","",NODATA)
    nRows,nCols=dirArray.shape
    blankArray=arcpy.RasterToNumPyArray(one,"","","",NODATA)
    del one
    ext=arcpy.Describe(FDIR).extent
    origin=ext.lowerLeft
    yMax,xMin=ext.YMax,ext.XMin
    cSize=fd.meanCellHeight
##  directions to find neighbour
    fDirs=(1,2,4,8,16,32,64,128)
    dCol=(1,  1,  0, -1, -1,-1, 0,1)
    dRow=(0, -1, -1, -1,  0,  1, 1,1)
##  flipped 
    dRow=(0,  1,  1,  1,  0, -1, -1,-1)
    aDict={}
    for i,v in enumerate(fDirs):
        aDict[v]=(dCol[i],dRow[i])

    with arcpy.da.SearchCursor(SOURCES,("Shape@","ID","DEM")) as cursor:
        for shp,ID, Z in cursor:
            arcpy.AddMessage('Processing source no %s' %ID)
            p=shp.firstPoint
            nR=int((yMax-p.Y)/cSize)
            nC=int((p.X-xMin)/cSize)
            while True:
                blankArray[nR,nC]=Z
                direction=dirArray[nR,nC]
                if direction==NODATA:break
                dX,dY=aDict[direction];nC+=dX
                if nC not in range(nCols): break
                nR+=dY
                if nR not in range(nRows): break
                S=blankArray[nR,nC]
                if S!=NODATA: break

    myRaster = arcpy.NumPyArrayToRaster(blankArray,origin,cSize,cSize)
    oneGrid=Con(myRaster<>NODATA,myRaster)
    oneGrid.save(outGrid)
    del dirArray,blankArray

except:
    message = "\n*** PYTHON ERRORS *** "; showPyMessage()
    message = "Python Traceback Info: " + traceback.format_tb(sys.exc_info()[2])[0]; showPyMessage()
    message = "Python Error Info: " +  str(sys.exc_type)+ ": " + str(sys.exc_value) + "\n"; showPyMessage()        
10
  • This seems promising, but a few things are unclear to me (maybe because I've never done "network searching" before. For step 2, how do I find the flow length corresponding to each source point? Next, how do I create "long rivers"?
    – Nena
    Commented Feb 24, 2016 at 13:29
  • Okay, I managed to get the test script (10 iterations) working with a few additional comments: (1) Set geoprocessing environment workspace to my output folder (I was getting errors when the script tried to save things to my Default.gdb folder). (2) I had to add an ID column to my sources shapefile, and calculate it as FID + 1. My attribute table did not match yours for some reason. (3) I had to change "DEM" to the header that I used in the Extract Multivalues to Points tool.
    – Nena
    Commented Feb 25, 2016 at 9:17
  • I am a bit concerned about the run-time for all 1200 source points - is there a way to make this more efficient? Like you said, it takes nearly as long to delete all intermediate files as to run the loop. If there was a way to do this in vector space (somehow linking polylines and assigning the source elevation to each polyline segment), that might speed up the process and/or take up less space. Maybe that is what network searching entails?
    – Nena
    Commented Feb 25, 2016 at 10:34
  • I tried to run the code for all source points, and it has now stopped twice (after reaching the 573rd and 591st source points, after about 1 hour processing each). Would it be possible for you to also explain the network searching approach, since the raster approach seems to be too unwieldy for this many points? I've added my error message to the problem above.
    – Nena
    Commented Feb 25, 2016 at 15:07
  • Sorry for all the comments - it looks like its probably caused by lack of space. 590 raster x 38 MB each = 22 GB, which is equal to the available space on the computer. It will not be possible to use this approach for this study area (especially since I'm planning to use a higher resolution DEM for the final product). If possible, can you please describe the network searching approach? Or explain how to delete the intermediate rasters as I go, instead of just deleting at the end?
    – Nena
    Commented Feb 25, 2016 at 15:16
4

I would say your problem is a network searching problem. You need to identify the source for every point on the network, it's distance and the elevations at the source and at point on network. Once you have all this information it is a join and then calculate.

RivEX can for any point on a vector network (so not raster) identify the source and the distance to it. You can extract source nodes and use these to extract elevation and as they all have ID's you simply join the data and compute you slope.

1
  • Thanks - is this something I can only do with RivEX? My company won't pay for such software packages, unfortunately...
    – Nena
    Commented Feb 24, 2016 at 13:26
1

With the basic assumption that water always flows down grade, you could take your stream raster and only where there is a data value attribute with the max elevation. Then divide the two rasters.

Now, how to calculate that max elevation raster is interesting. Assuming you have spatial analyst extension, I would us the Focal Statistics tool and create a raster of using the Maximum option, defining your neighborhoods by stream order.

Your Answer

By clicking “Post Your Answer”, you agree to our terms of service and acknowledge you have read our privacy policy.

Not the answer you're looking for? Browse other questions tagged or ask your own question.