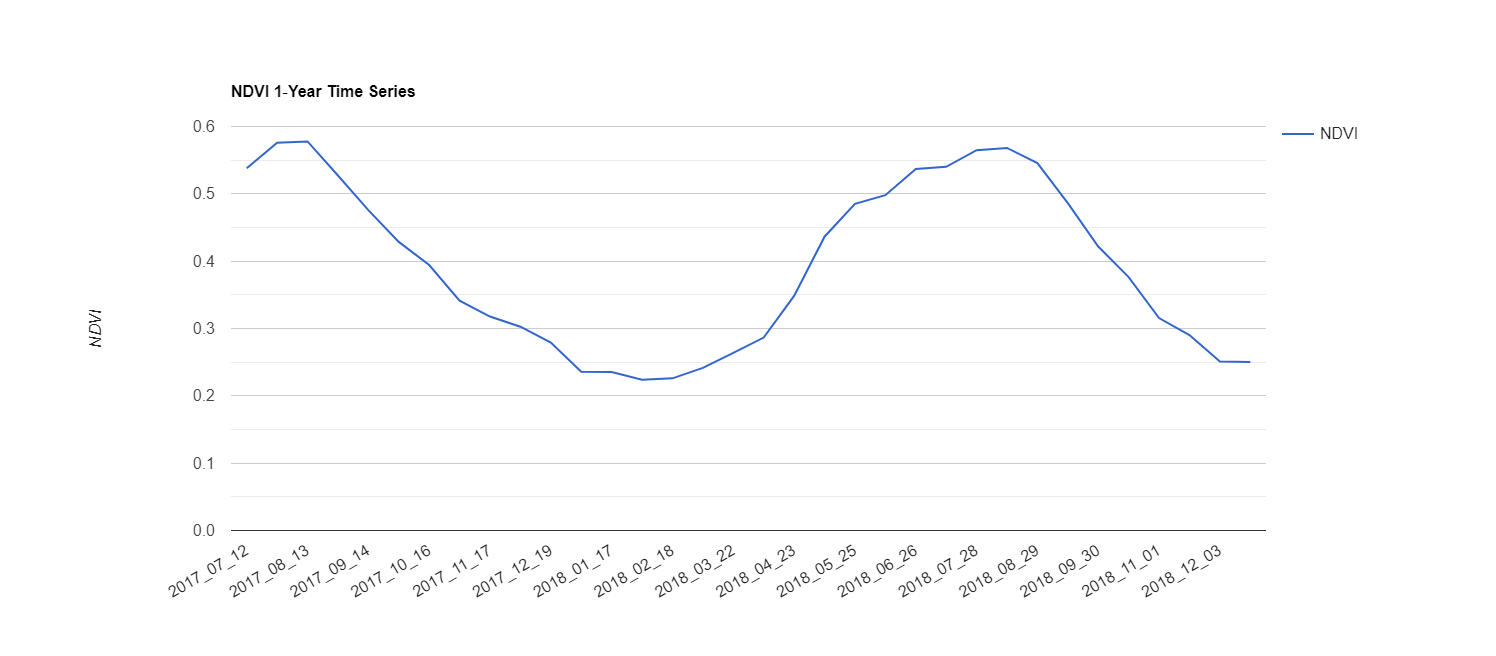
I'm new to GEE. I'm currently working on NDVI data analysis. So this is my code for MODIS NDVI. I already run the NDVI scale factor function and do the image collection, Divide by 10000, in images there inside ImageCollection to get real NDVI values. Now that I'm interested to plot the chart, but I got some error to be like,
Error generating chart: No features contain non-null values of "system:time_start".
var NDVI = function(image) { return image.expression('float(b("NDVI")/10000)') };

var collection = ee.ImageCollection('MODIS/006/MOD13Q1'); var col = ee.ImageCollection(collection.filterDate('2017-07-01', '2018-12-31')); var modisNDVI = col.map(NDVI); print(modisNDVI)

// Chart a single year mean of SB # since 1981 var TS1 = ui.Chart.image.series(modisNDVI, geometry, ee.Reducer.mean(),500, 'system:time_start') .setOptions({ title: 'NDVI 1‐Year Time Series', vAxis: {title: 'NDVI'}, }); print(TS1);
https://code.earthengine.google.com/e7405c083d417b42b8a2a2ae3d3166e9

