The title question is overly simplistic, but would accomplish what I am looking for. I have generated a clipped *.tif raster using gdal.Warp and a georeferenced satellite image:
OutTile = gdal.Warp(newRasterLocation, rasterSourceFile, cutlineDSName=shapefileSourceFile, cropToCutline=True, dstNodata = 0)
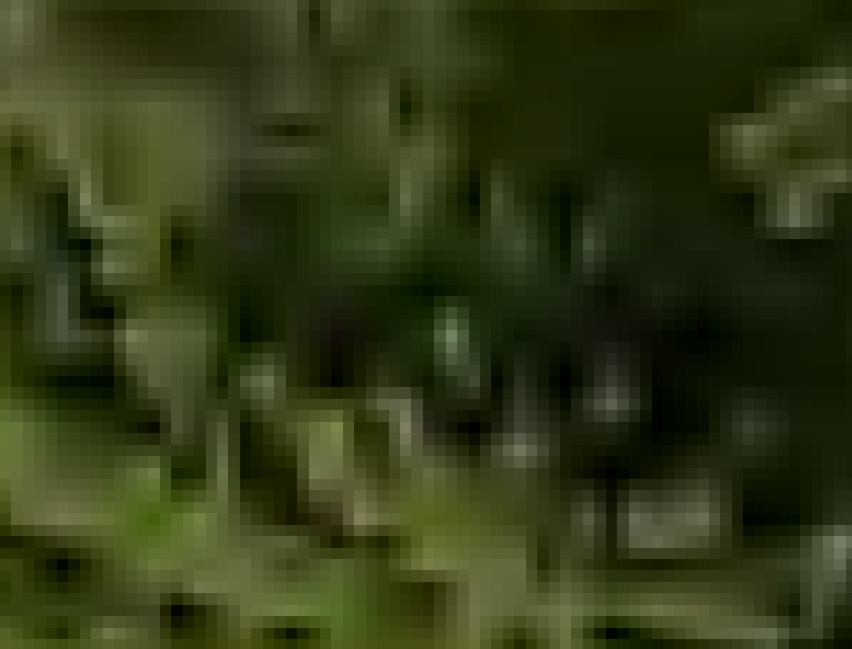
When I open this raster in a simple image viewer, I get something like this (case A):

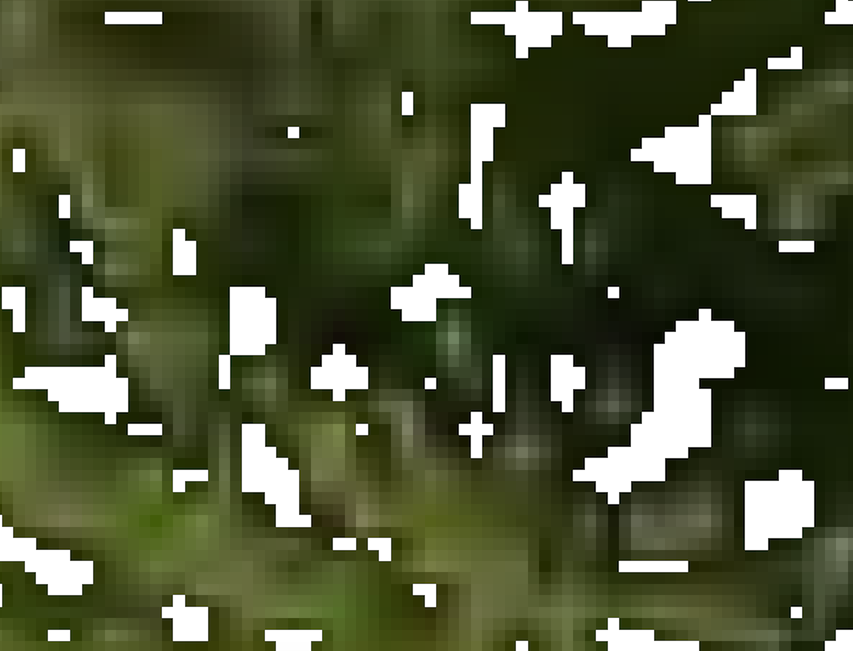
When I import this same raster into QGIS as a new layer, I see many regions where what I imagine would be centered around the darker spots, but not pure black values (or any one single color, case B):

If I uncheck the No Data Value indicator in the Transparency menu, the previously Case B image (with transparency holes) reverts to the Case A image.
What does the No Data Value check box control? I am thinking this is related to the dstNodata setting in the generation, but why would this affect more than one color? And why would toggling the No Data Value check box have any affect, if this was a property of the generated image?
(the image is a tree zoomed in, the dark spots are shadows. I am interested in this exclusively graphically, and don't plan on doing anything with the raster data other than showing the image).
