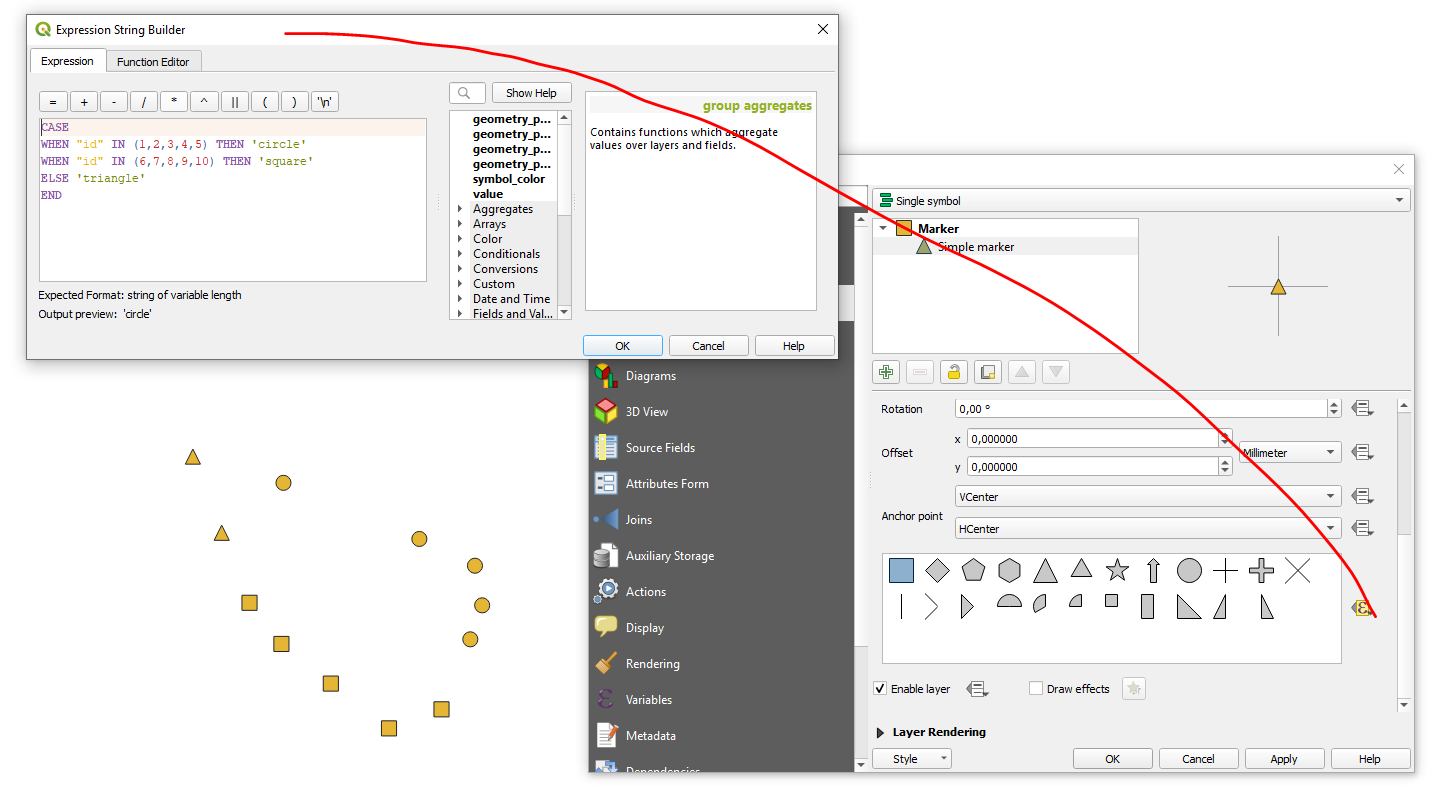
I have a map about different locations of amphibians. I want that the colors illustrates the specific species and the form illustrates the stadium (young, adult). I know how to give different colors according to the species, but I didn't managed to also add different forms.
The problem is similar to the following one Setting symbology type and color based on data using QGIS but the answer there didn't helped me. I think it works by using rule based symbology, but I didn't managed to find out how I have to set my rules.

