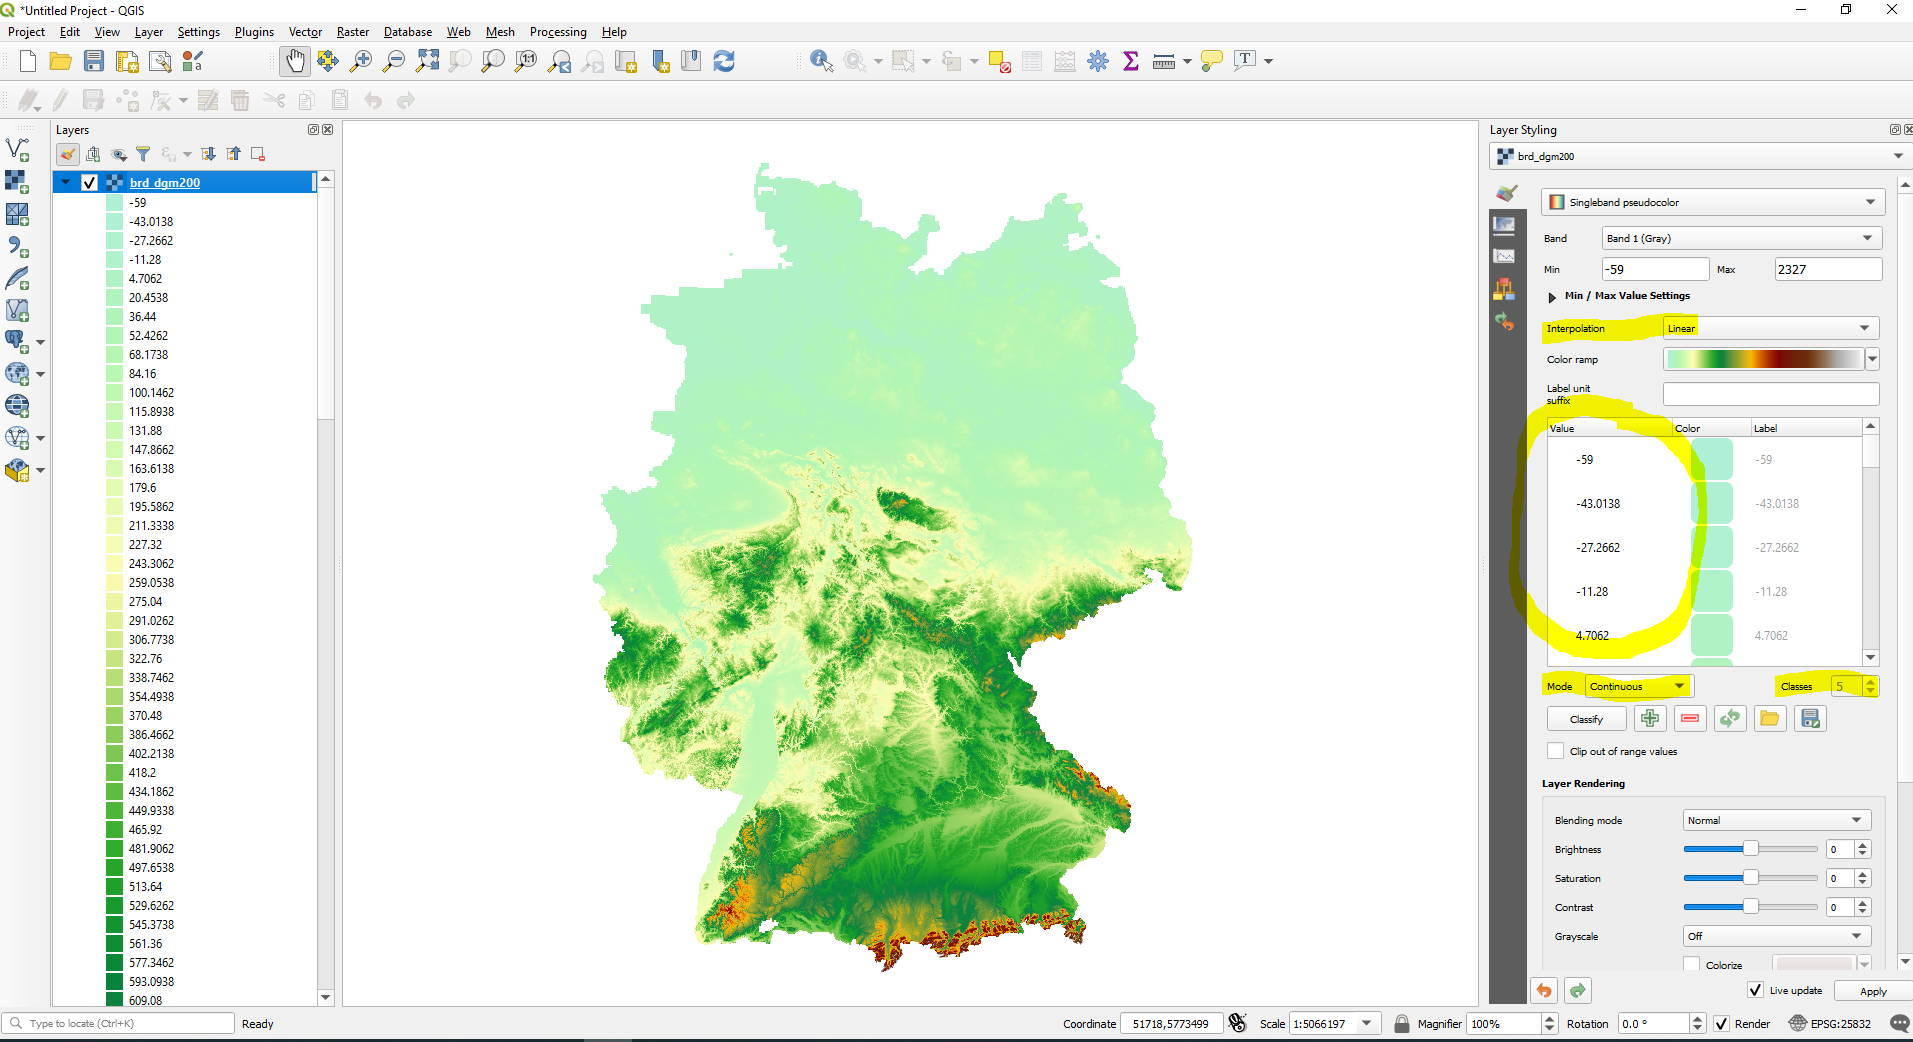
I have a raster with quantitative data (continuous values from a given minimum to a maximum). In this case its elevation, but it could also be temperature, precipitation, etc. Whenever I want to visualize these kind of raster data in QGIS I run into problems. I know I should use "singleband pseudocolour" and I can use the Interpolation / Mode / Classes options and I can also manually change the class breaks under "Value".
But how can I define an interval to automatically create classes? For example I want class intervals of e.g. 250 (0-250, 25-500, 500-750, 1000-1250, etc.). In ArcGIS it's quite easy to define this interval for ALL classes. There, the amount of classes is automatically calculated from the min / max values and the defined intervall. In QGIS I have to do all the work by myself. Especially changing all the class breaks manually can be a lot of work. In case I want to change the intervall (for example from 250 to 200), I have to do the manual work all over again.
Am I overlooking this option or is it just not possible to define a fixed intervall for all classes in QGIS?

