Why is my WKT Shape:
import geopandas as gpd
import pandas as pd

df = pd.DataFrame({'foo':[1], 'geom_wkt_epsg4326':['MULTIPOLYGON(((16.550706663337998 48.56271555889241, 16.551262218893598 48.56271555889241, 16.551262218893598 48.56216000333681, 16.553484441115998 48.56216000333681, 16.553484441115998 48.56160444778121, 16.555151107782798 48.56160444778121, 16.555151107782798 48.56271555889241, 16.5557066633384 48.56271555889241, 16.5557066633384 48.56382667000361, 16.555151107782798 48.56382667000361, 16.555151107782798 48.5643822255592, 16.5557066633384 48.5643822255592, 16.5557066633384 48.5649377811148, 16.5568177744496 48.5649377811148, 16.5568177744496 48.5654933366704, 16.5573733300052 48.5654933366704, 16.5573733300052 48.566048892226, 16.5584844411164 48.566048892226, 16.5584844411164 48.5671600033372, 16.552373330004798 48.5671600033372, 16.552373330004798 48.566048892226, 16.551262218893598 48.566048892226, 16.551262218893598 48.5654933366704, 16.550706663337998 48.5654933366704, 16.550706663337998 48.56271555889241)),((16.5584844411164 48.56382667000361, 16.559039996672 48.56382667000361, 16.559039996672 48.5643822255592, 16.5584844411164 48.5643822255592, 16.5584844411164 48.56382667000361)),((16.5607066633388 48.5643822255592, 16.5601511077832 48.5643822255592, 16.5601511077832 48.56382667000361, 16.5607066633388 48.56382667000361, 16.5607066633388 48.5643822255592)))']})

from shapely import wkt
df['geometry'] = df['geom_wkt_epsg4326'].apply(wkt.loads)
display(df.head())
df.crs = "EPSG:4326"
print(df.crs)

df.plot()
empty and not plotting in geopandas or QGIS?
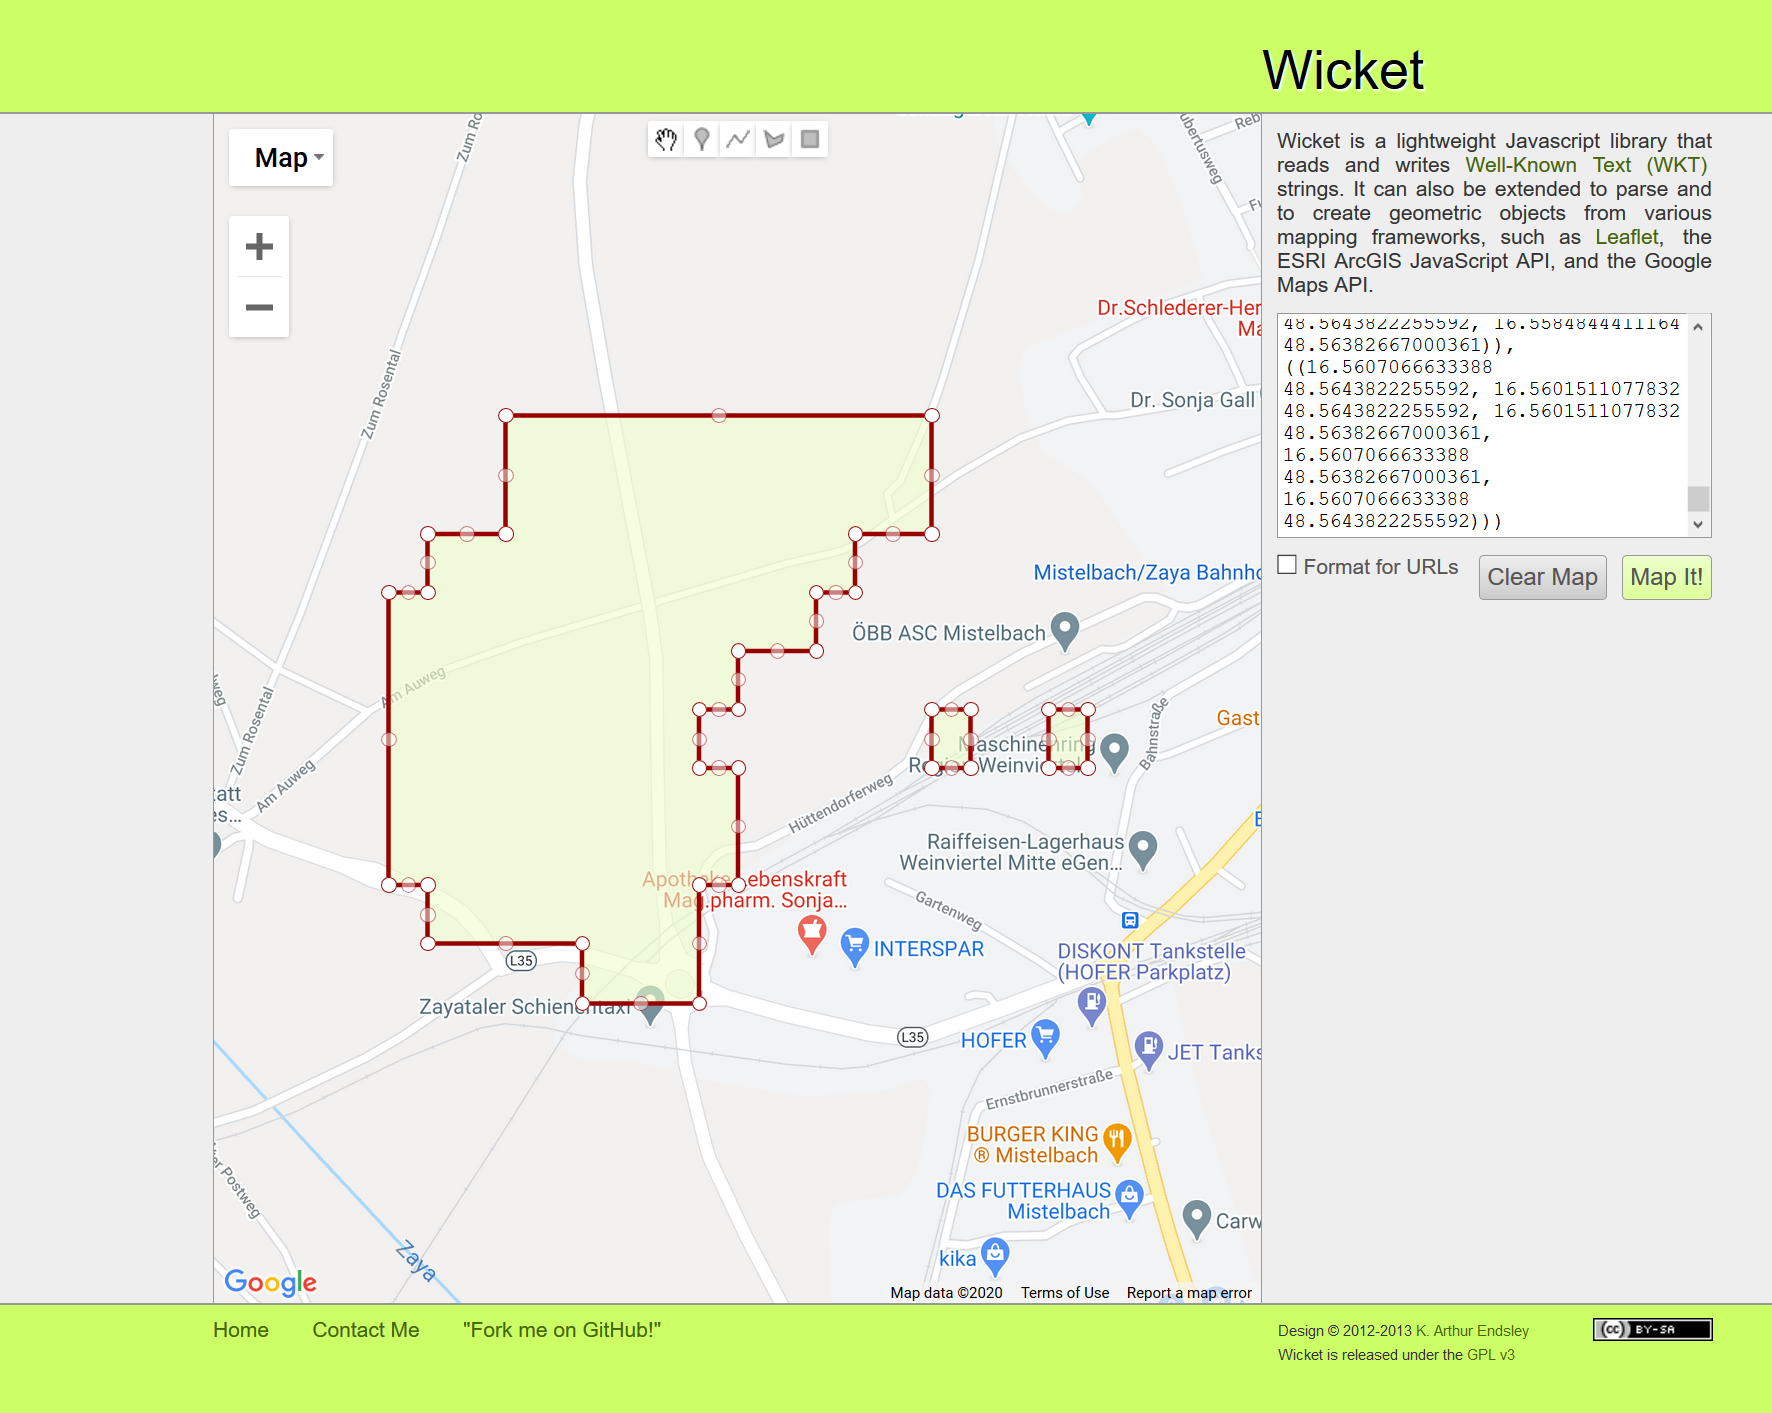
NOTICE: https://arthur-e.github.io/Wicket/sandbox-gmaps3.html is plotting it just fine as:
This seems very strange to me, that QGIS or GeoPandas should not be able to visualize the result.

