5

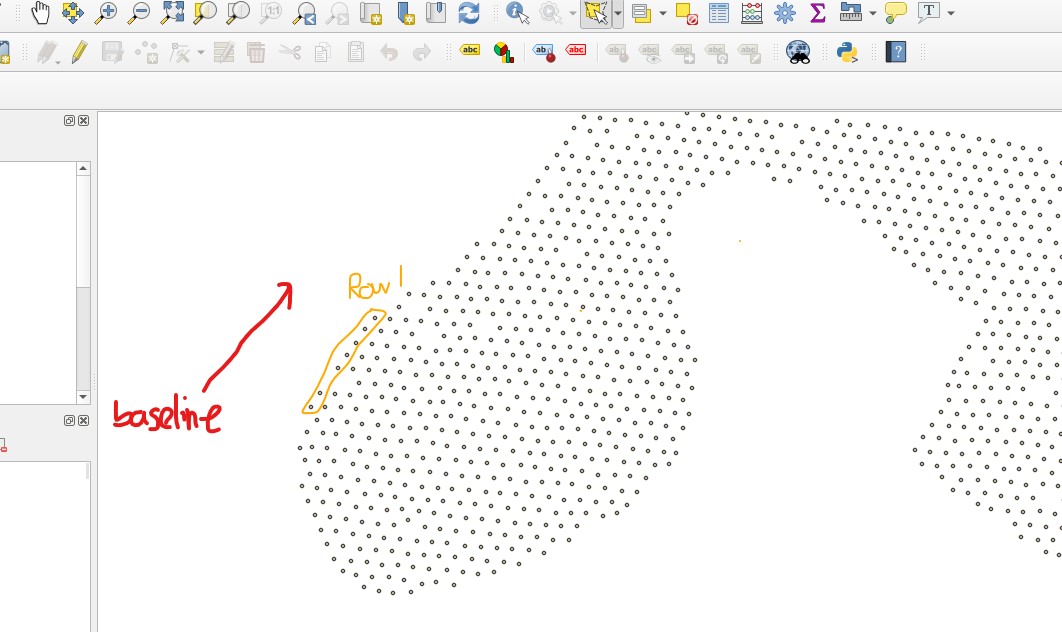
I have a shapefile that contains a number of points, each point represents a tree. I would like to calculate how many trees there are per row.

Hence my question (I think this is the best method), how do I automatically draw a line along a row (ideally of a baseline direction) and then calculate how many points are on that line (row)?

Apologies for the terrible drawings

3
  • 2
    You need to rotate and skew the points by an affine transform and then snap to a grid. Can all be done with custom Python code within QGIS. Might be possible with built-in operators and processing functions though... Can you supply some sample data to save us digitising all the points in your image :)
    – Spacedman
    Commented Dec 10, 2020 at 15:57
  • 1
    How can you define a row? a line with 45° direction?
    – Taras
    Commented Dec 10, 2020 at 20:02
  • 1
    Thanks once again, here is the raw data if you fancy playing around with it: we.tl/t-1TZhdcSLeQ
    – Curtis
    Commented Dec 15, 2020 at 9:33

3 Answers 3

4

Since you provided the test data:

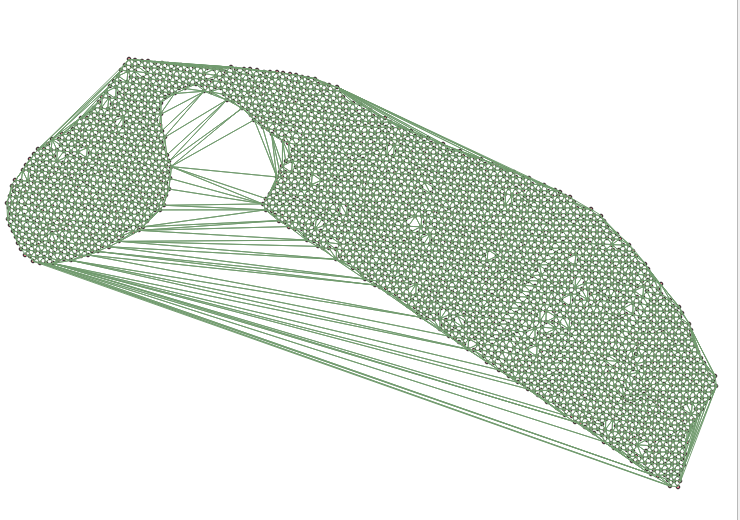
  1. Run the tool "Vector -> Geometry Processing -> Delaunay Triangulation" on the test data, then "Polygons in Line" and then "Blow up" them, the result is in Figure 1 enter image description here

and save it to a file named "test_blobup";

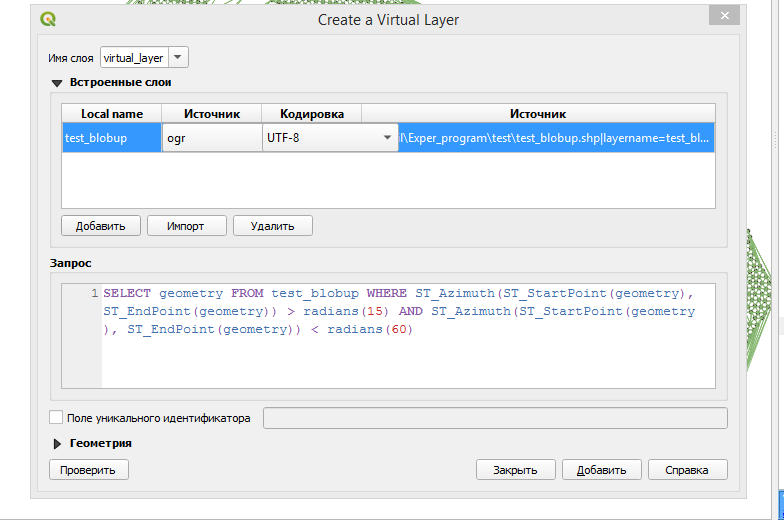
  1. Create a new virtual layer and run this script (see in Figure 2):

enter image description here

SELECT geometry FROM test_blobup WHERE ST_Azimuth(ST_StartPoint(geometry), ST_EndPoint(geometry)) > radians(15) AND ST_Azimuth(ST_StartPoint(geometry), ST_EndPoint(geometry)) < radians(60)

Result in figure 3,

enter image description here

and remove possible artifacts, in edit mode "pencil";

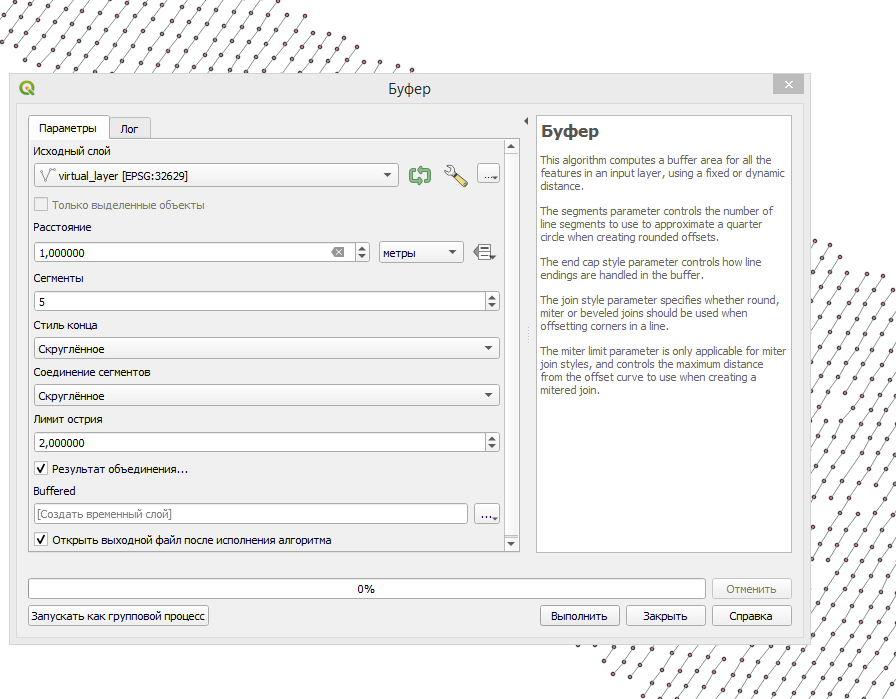
  1. Run "Vector->GeoProcessing->Buffer" and set the field values like in my image 4 and transform it with "Vector->Processing geometry->Single parth". Figure 4

enter image description here

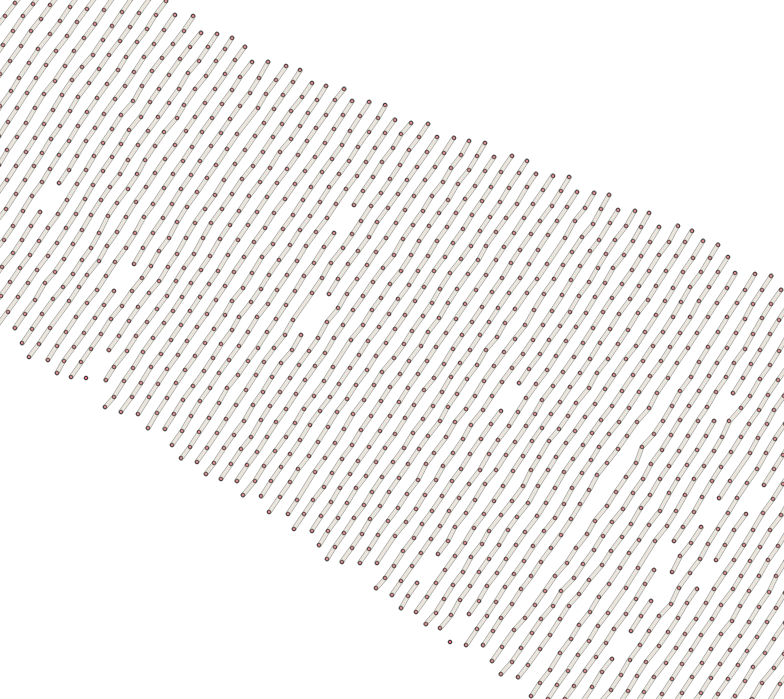
The result is in Figure 5

enter image description here

  1. Save the temporary layer to a file, for example called "test_single_parth" and create with the "field calculator" a column of any name (for me "row") and create in it "Expression $id";

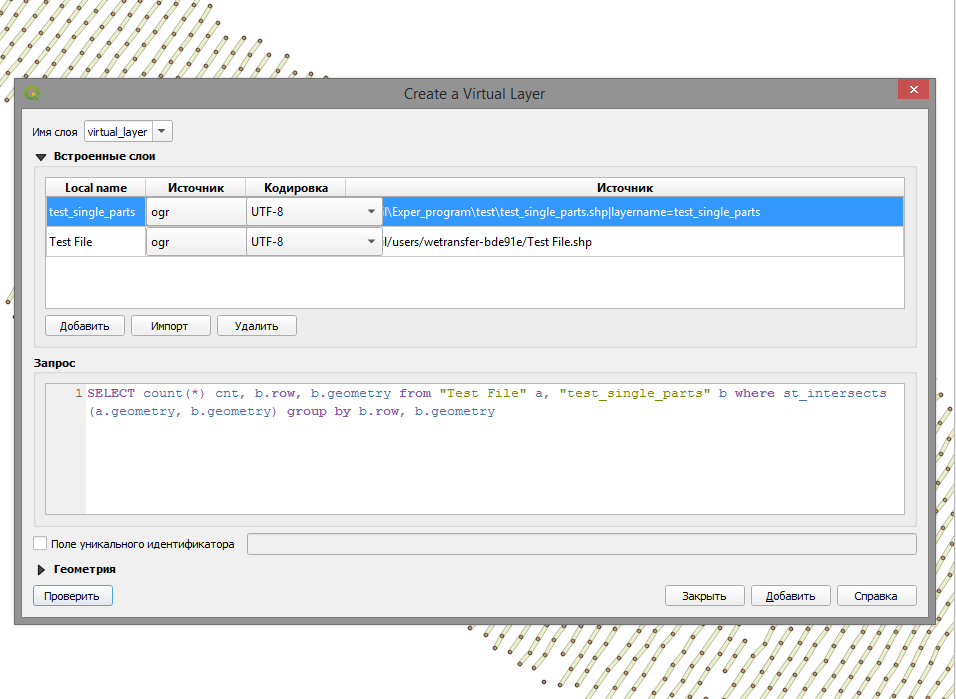
  2. Create a new virtual layer and run this script (see in figure 6)

enter image description here

SELECT count(*) cnt, b.row, b.geometry from "Test File" a, "test_single_parth" b where st_intersects(a.geometry, b.geometry) group by b.row, b.geometry

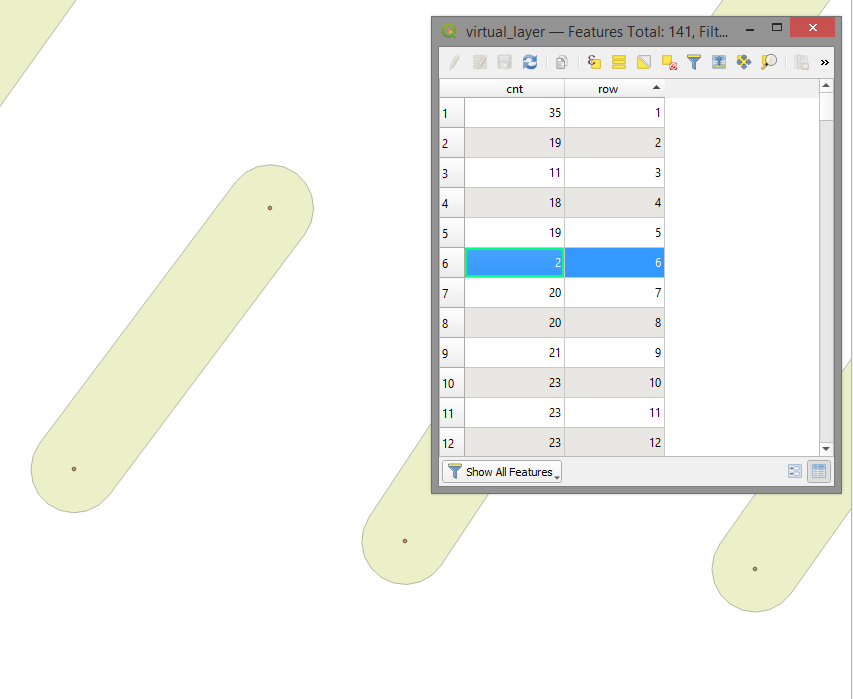
The result is in figure 7,

enter image description here

www.deepl.com/ru/translator

3

Use Menu Processing / Toolbox / Geoemtry by expression and insert the following expression for your point layer. The expression creates lines along the points and then a buffer around it to get a polygon. Now you can use the function Count points in polygon.

Probably some of the values should be adapted to your data. Without knowing more about the structure of your data, this is an expression that works in all cases as long as the point are located on parallel lines (tolerating a certain offset). This general functionality however means that a few values maybe need to be adapted to get an optimal result. If you provide more information, I can tell you how to adapt the expression.

Best first use a symbol layer, set to geometry generator rendering style, and paste the expression there. Then you can see in realtime how different settings affect the output. When you are satesfied, copy the expression to Geometry by expression as mentioned above, create the polygons and count the points. Which values should be adapted is explained below. Here is the expression with some default values:

collect_geometries ( 
   array_foreach ( 
      array( 179,5,50,67,6,12,7,61,53,97,8,76,44,55,9,11,21), 
      buffer (
         extend ( 
            make_line ( 
               geometry (get_feature_by_id (@layer, @element)) ,
               project (
                  geometry (get_feature_by_id (@layer, @element)) ,
                  240000,
                  azimuth ( 
                     geometry ( get_feature_by_id ( @layer , 179 ) ) ,
                     geometry ( get_feature_by_id ( @layer , 133 ) ) )
               )
            ), 
         120000, 
         0 ) , 
      1900 )
   )
)

Which settings you should change:

Let's assume you have points along a series of lines randomly distributed, as in the following screenshot. To get this solution to work, you should know from each line a unique identifier for one point - not important where this point is, at the beginning or at the end of the line, just one point per line (row). See the red points on the screenshot with their "fid" as label. If your points ar not random and you have a rule for the fid (say the fid-s of the first point on every line have a regular interval), it's even easier to create an array of the ids (one point per line). In this case you can create the array automatically. But let's assume we have random points, so we must define the array manually by selecting the fid for a point on each line: array( 179,5,50,67,6,12,7,61,53,97,8,76,44,55,9,11,21) - that's the third line of the expression - change the values according to your data.
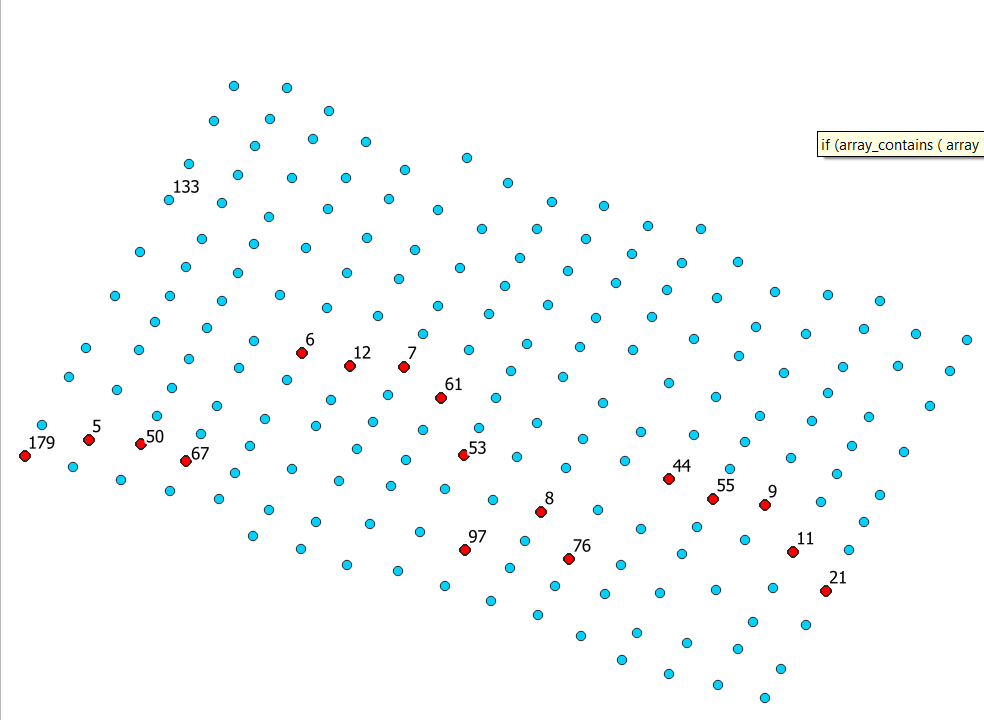
enter image description here

We use this array of fid-s to create a line through each point. Since all lines are parallel, they have the same azimuth. Thus we calculate the azimuth in one case with two arbitraty points - let's take point 179 at the bottom left and 133 on the same line (change 179 and 133 according to your data - single condition: the numbers should refer to a unique identifier of points on the same line/row):

azimuth ( 
   geometry ( get_feature_by_id ( @layer , 179 ) ) ,
   geometry ( get_feature_by_id ( @layer , 133 ) )
)

We can now draw a line from each point we selected (in the array) to another point we create by shifting this point for a certain distance in the same direction (azimuth) we calculated before, using the expression project(point,distance,azimuth), whereas distance is arbitrary - just long enough to cover all points. In the above expression the distance is set to 240000 - change this that if fits your points.

Because not all points lie on the same side of the arbitrary point from the array, we extend the line to the other side, using the epxression extend (geometry, start_distance, end_distance) - start_distance again is arbitrary, long enough to cover all points to the other side - I used 120000, change this as well until it fits your needs. end_distance can be 0 because we already set the length for the end of the line before when we created the line.

Now we draw a buffer around the line to be sure to catch all points in case they are not positioned exactly on a line. The buffer size should be small enough to be sure not to overlap the buffer of neighboring lines. See my value for the buffer size above is set to 1900 - you can also change this. If you have quite irregular locations for the points (not exactly on a line), increase the buffer size.

We can now automatically repeat this procedure for each point we defined at the beginning in our array, using array_foreach. Finally, we use collect_geometries to get a MultiPolygon. We're done, the buffets show up along the line, embracing the points.
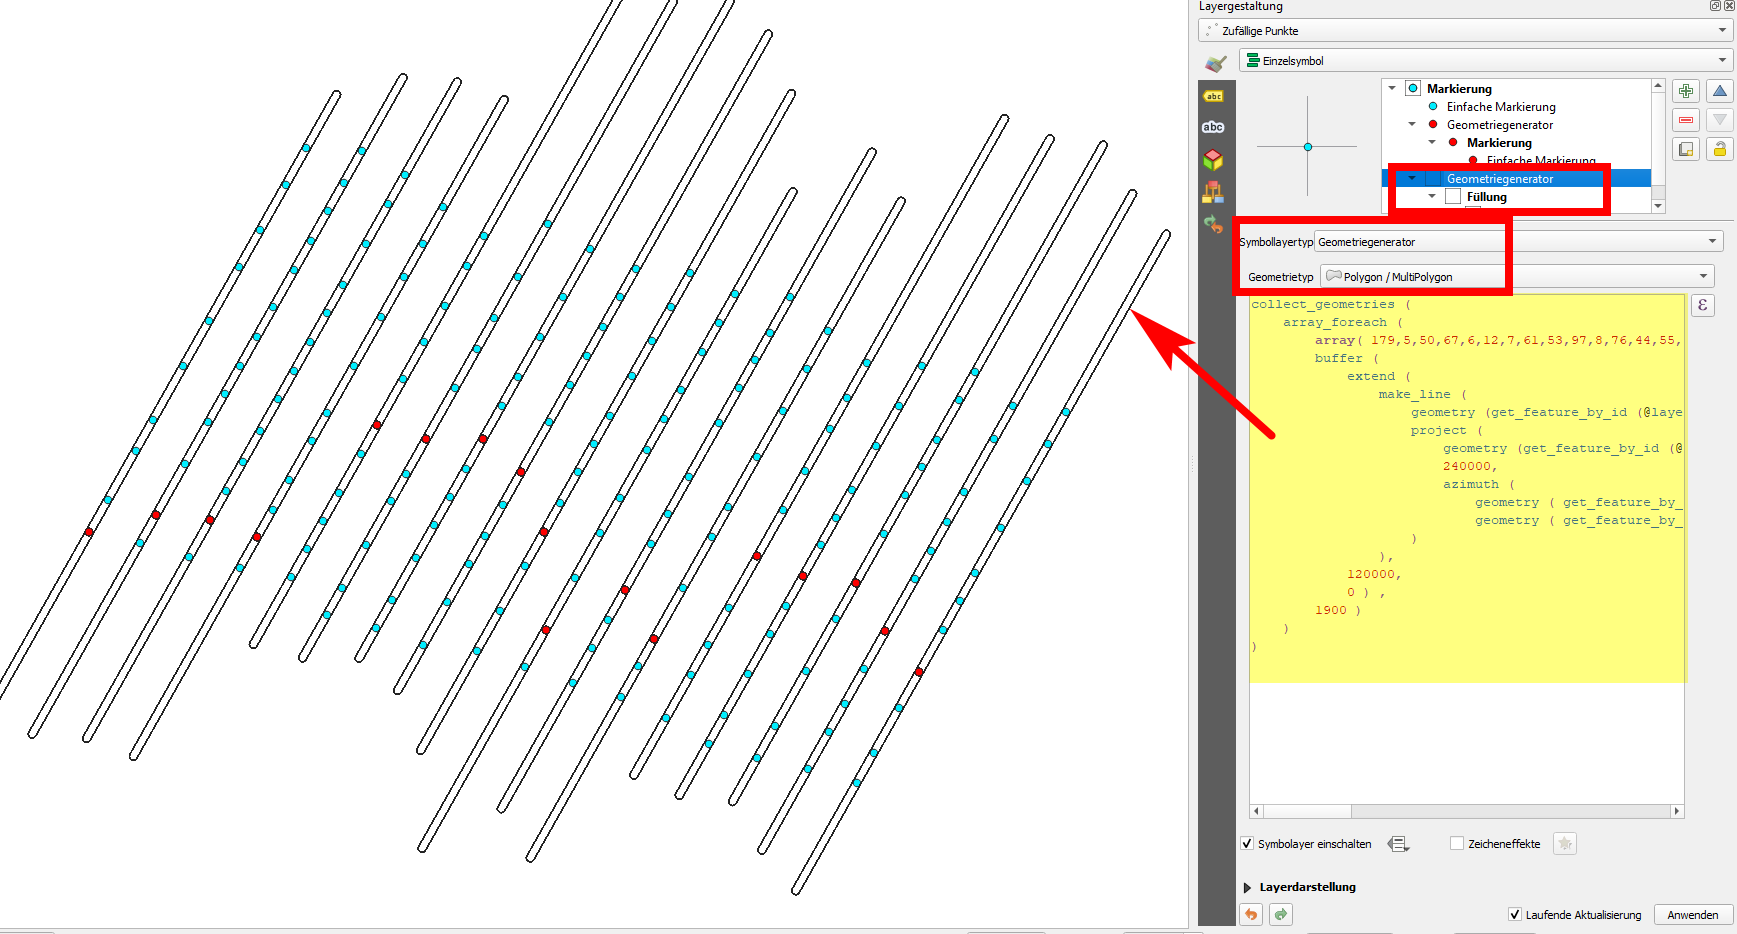
enter image description here

1
  • Thank you very much! I will give this a go a report back!
    – Curtis
    Commented Dec 11, 2020 at 11:02
0

Another solution is be the following - it's quick and effective, but not so elegant as it involves a bit of manual work. But probably here it's the most efficient way: a more elegant, automatic solution would be an overkill and too laborious for the limited set of data you have.

Fast explanation, for details see below:

  1. Draw lines manually from the first to the last point of your row.
  2. Create a buffer for the lines - ideally as wide as possible but as narrow as not to overlap
  3. Use the Count points in polygon tool to get the number of points per row.

The details: After uploading your data, I see that the points in a row don't lie exactly on a line and you also don't have any attributes that would allow to get automatically the order of your rows. I will propose another approach to solve this, even though the first solution should work as well (just be careful to set the values that the buffers do not overlap).

In case you have just these data and not tens of thousend of different rows, I guess automatizing would be an overkill and cost you more time than doing it in a semi-manual way. The best is to draw manual lines from the first to the last point of each row. Use snapping the get the line really on the points. This might also allow you to copy the lines and shift it in parallel using the tool Advanced Digitizing Toolbar / Move feature, snapping the line to a point of the next row. This is a very fast and effictive way to get the rows for counting.

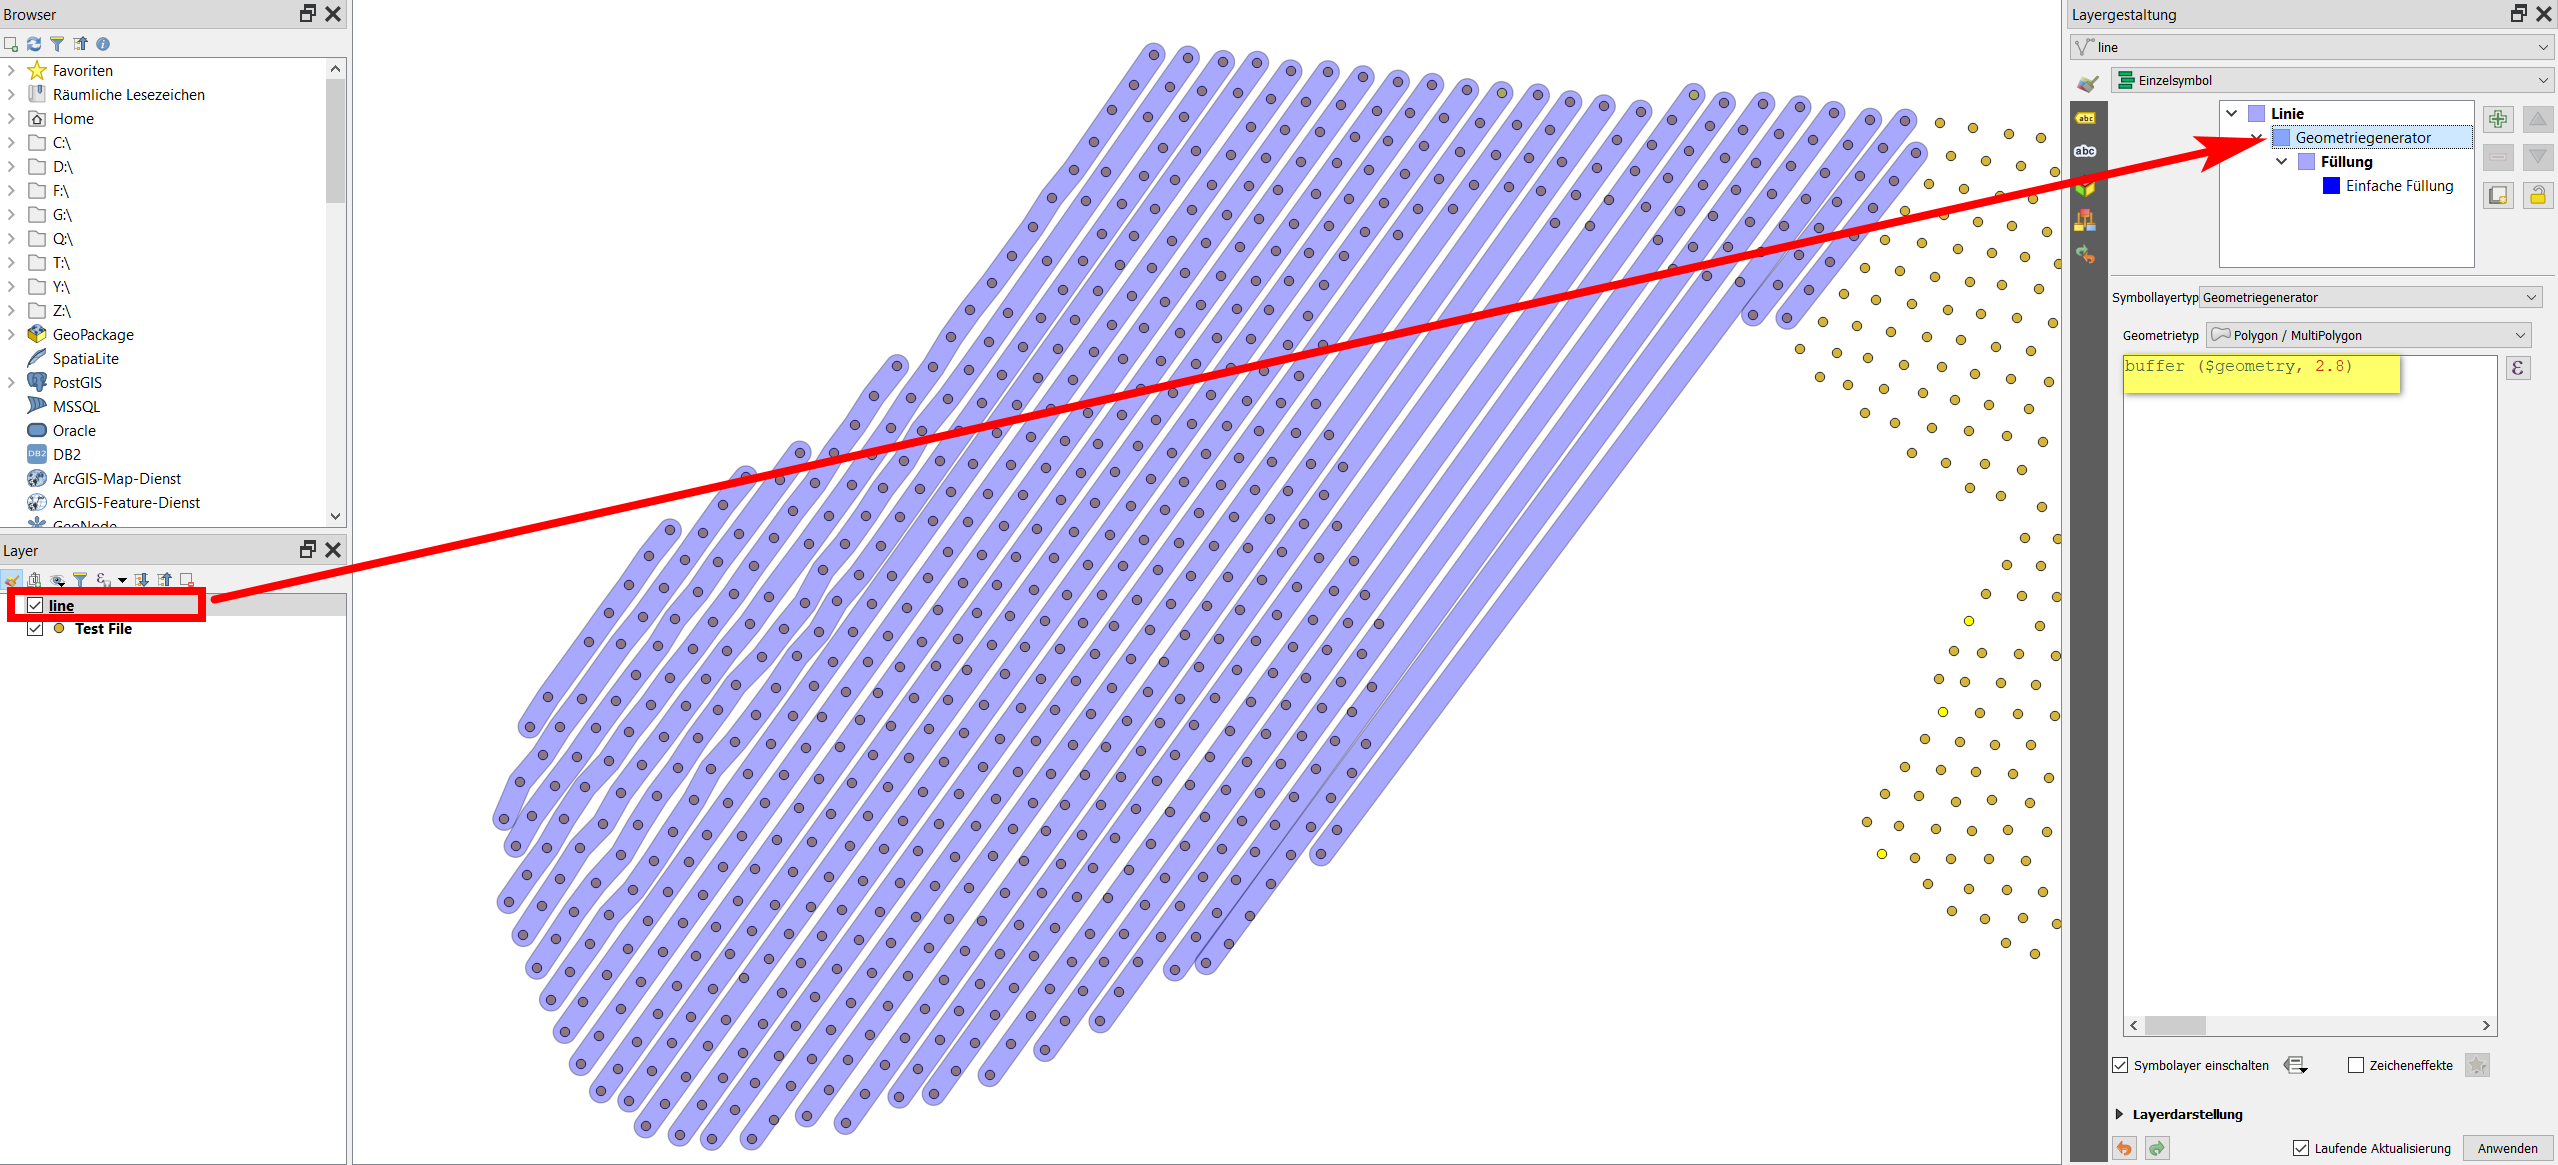
You can use a geometry generator symbol layer with buffer ($geometry, 2.8) so that when drawing the line, you immediately see the buffer. You can use a semi-transparent style as seen on the screenshot:

enter image description here

I did it for a few rows - in the first few rows, I connected each point of the row with the line (you see it around the 5th line from left at the bottom, it's not straight), the others I just connected first to last point - quick but effective, precise enough for what you want to do. Setting a buffer size of 2.8 creates minimal overlapping with maximum coverage of the points.

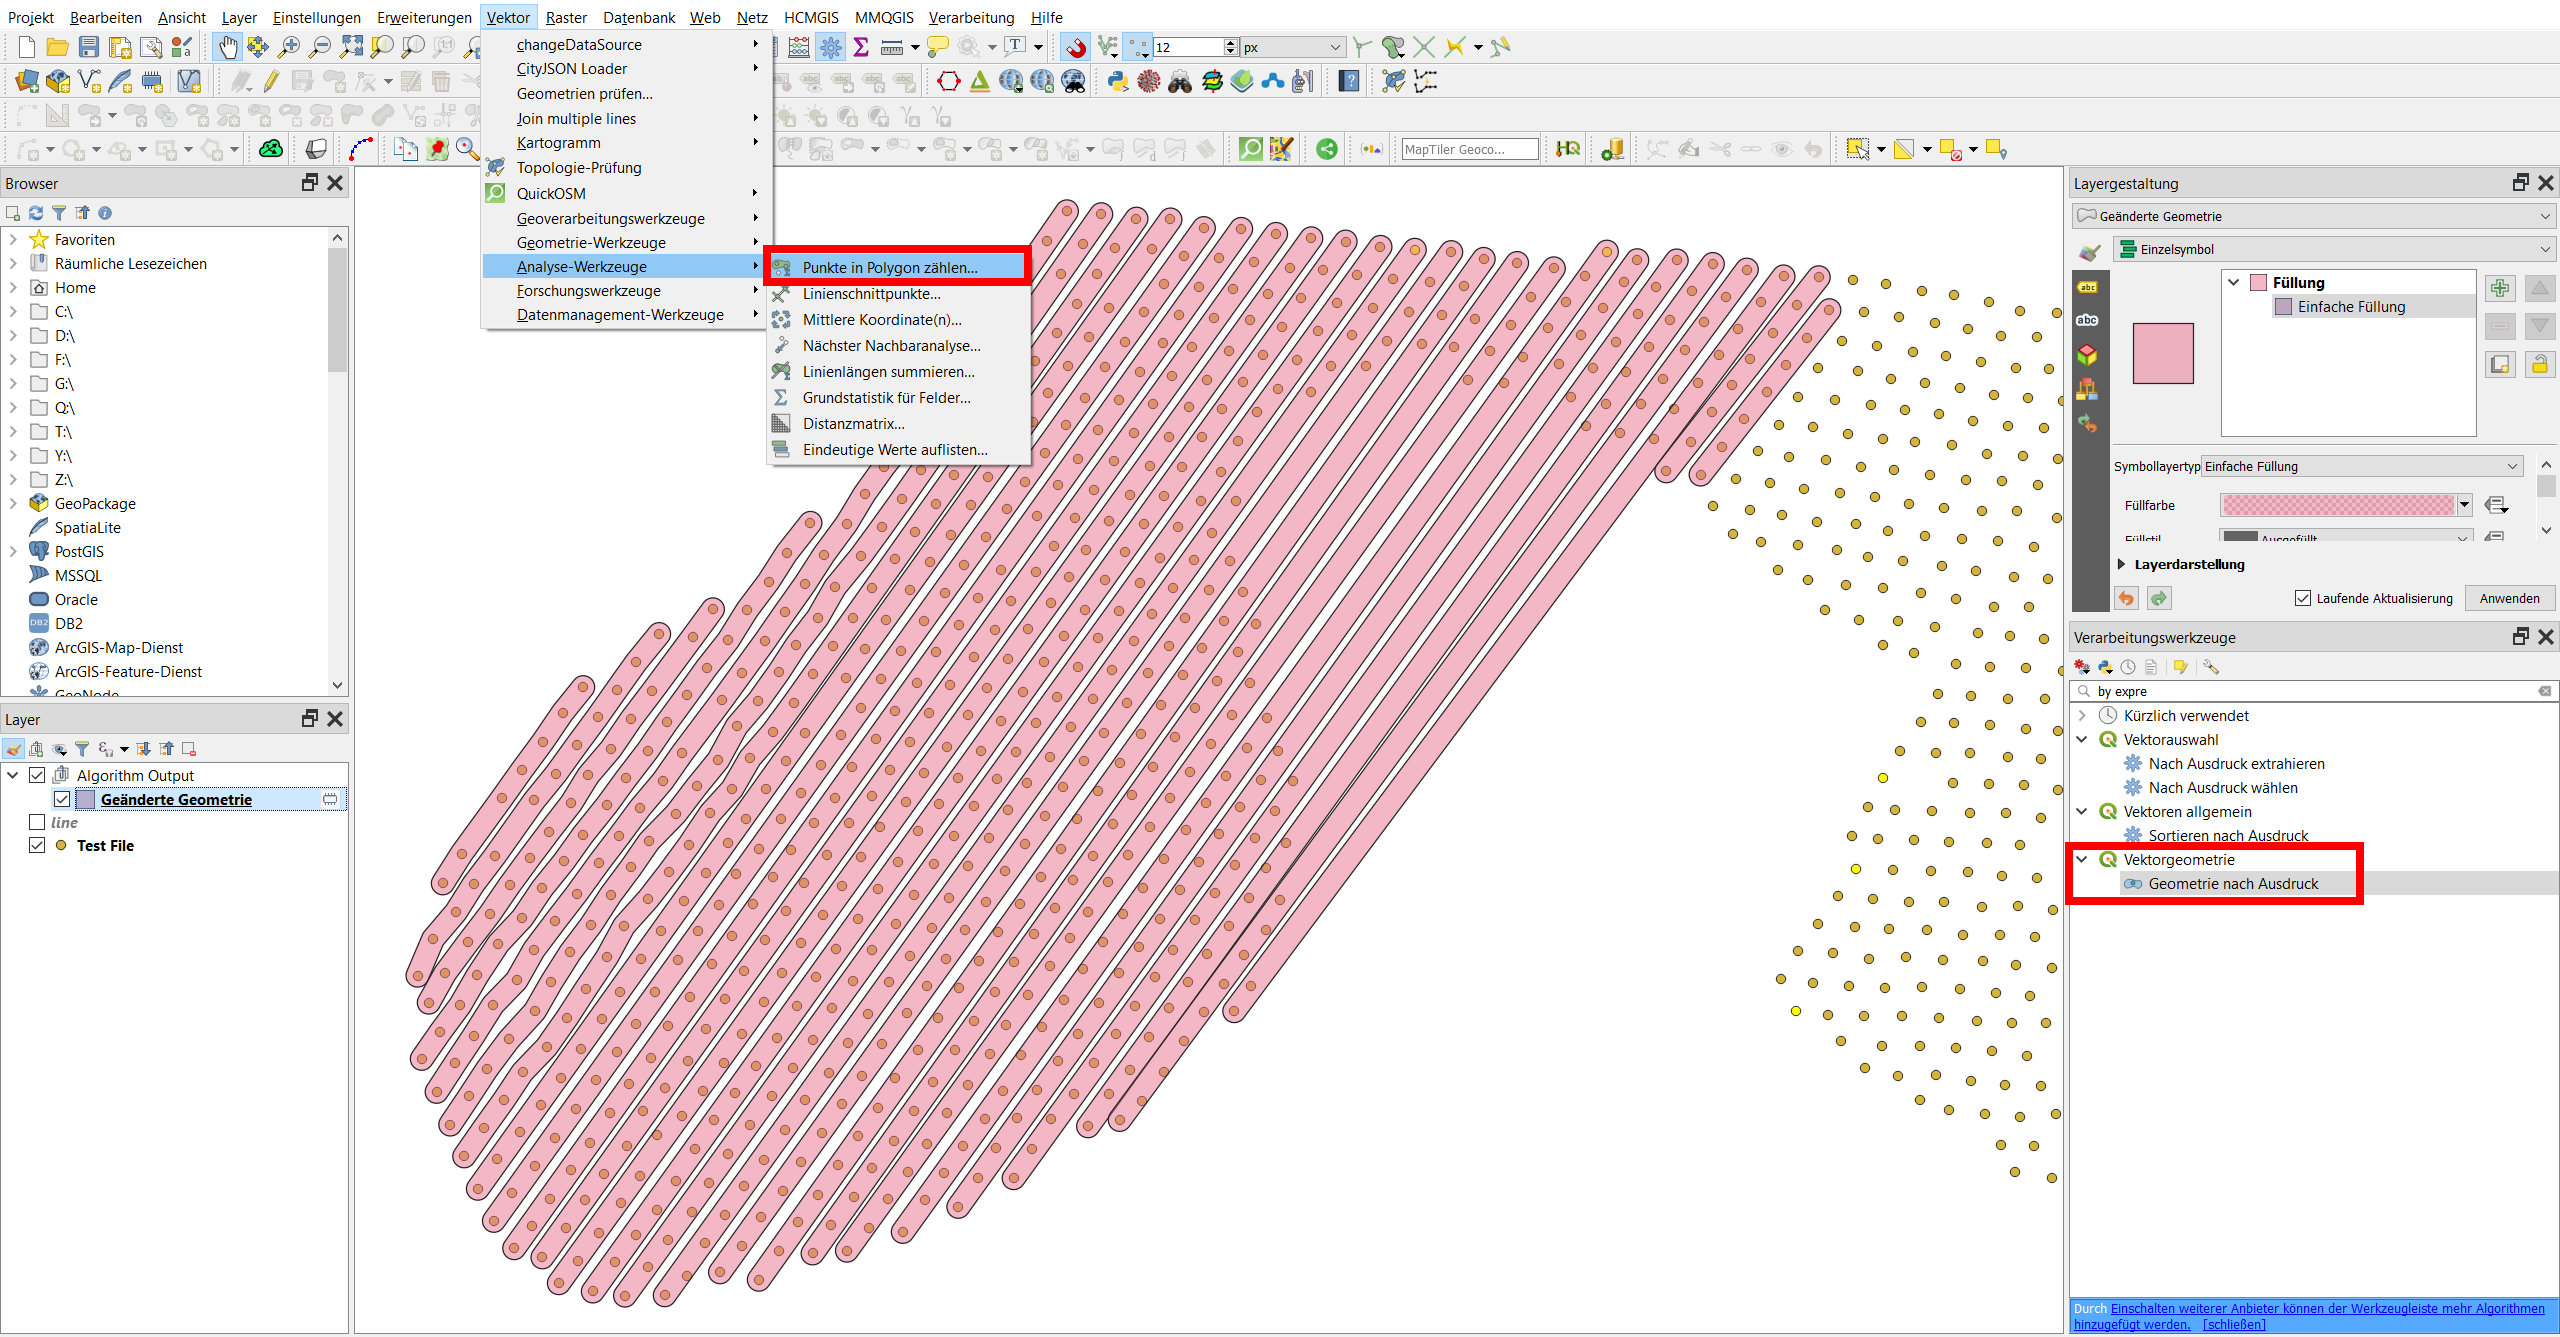
When done, convert the created line layer with Menu Processing / Tollbox / Geometry by expression and paste the same expression buffer ($geometry, 2.8), creating the buffers as actual geometry. Now use Menu vector / Analysis Tools / Count points in polygon as shown here:

enter image description here

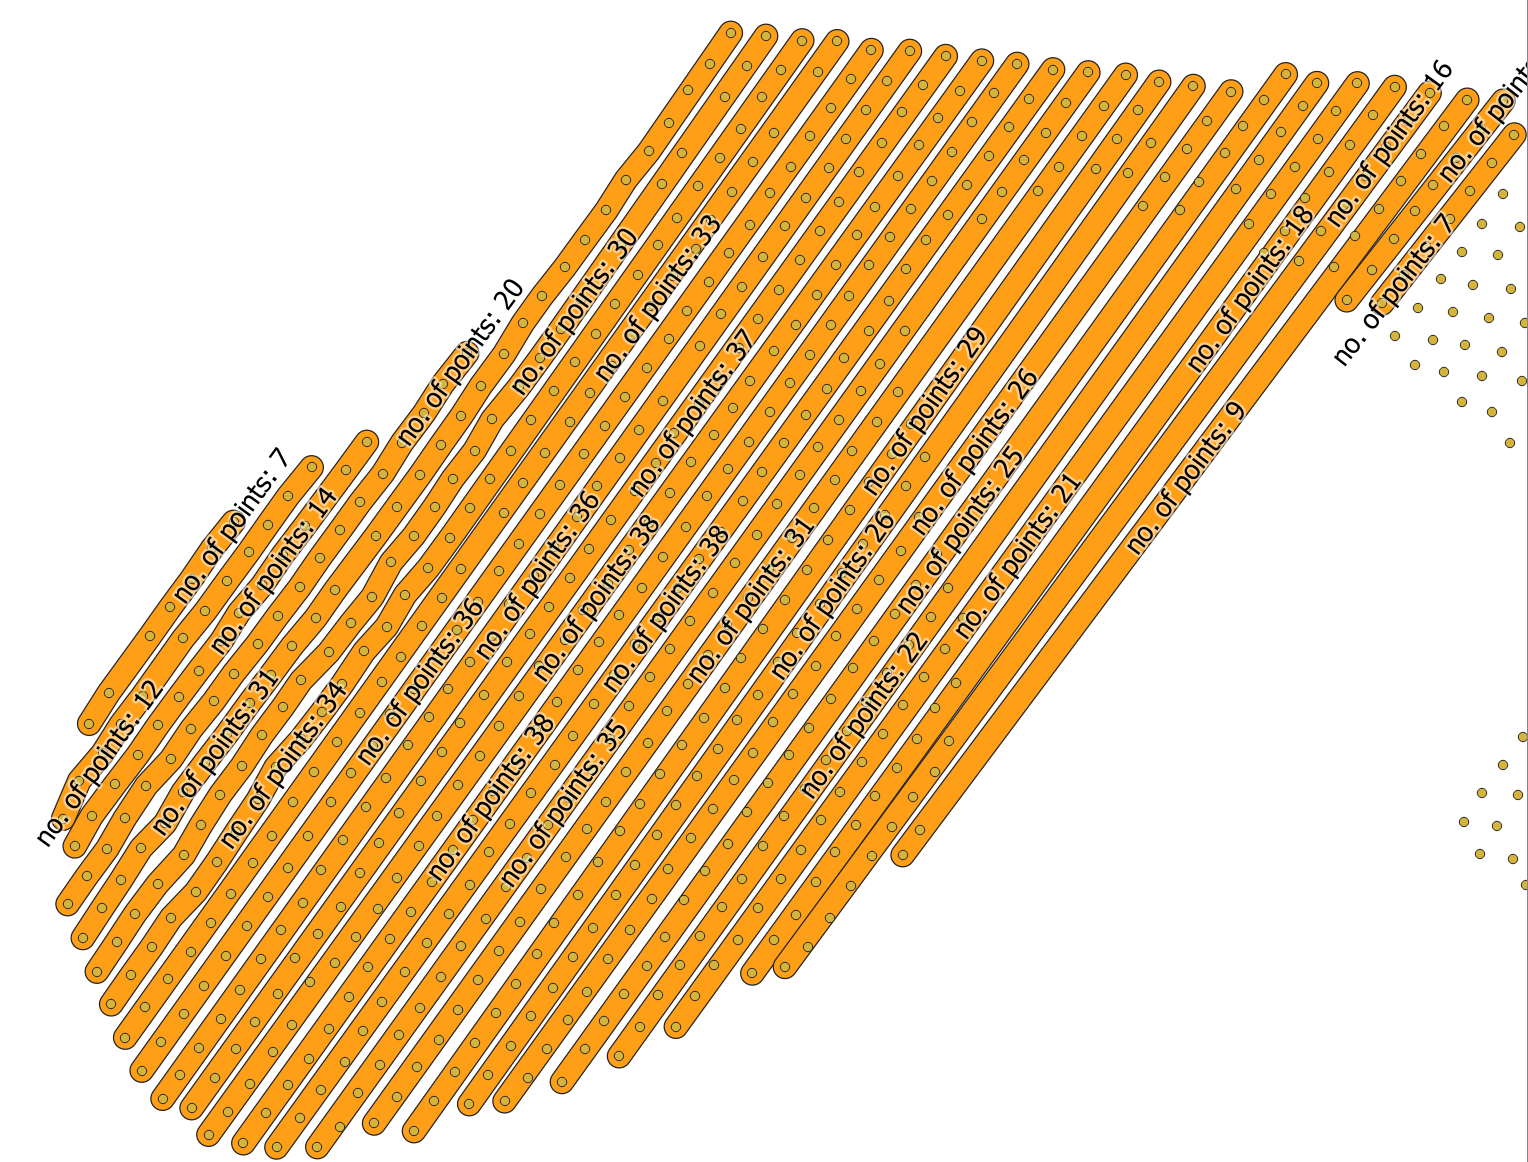
You get a new layer with a new attribute NUMPOINTS that contains the no. of points, see the result using this field for labeling:

enter image description here

Your Answer

By clicking “Post Your Answer”, you agree to our terms of service and acknowledge you have read our privacy policy.

Not the answer you're looking for? Browse other questions tagged or ask your own question.