1

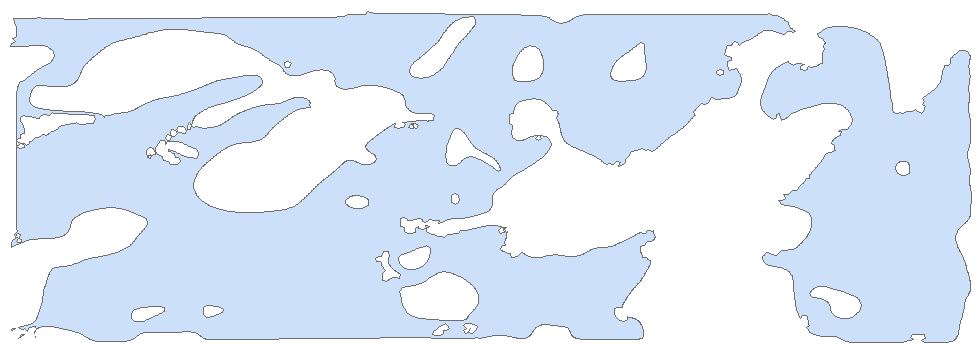
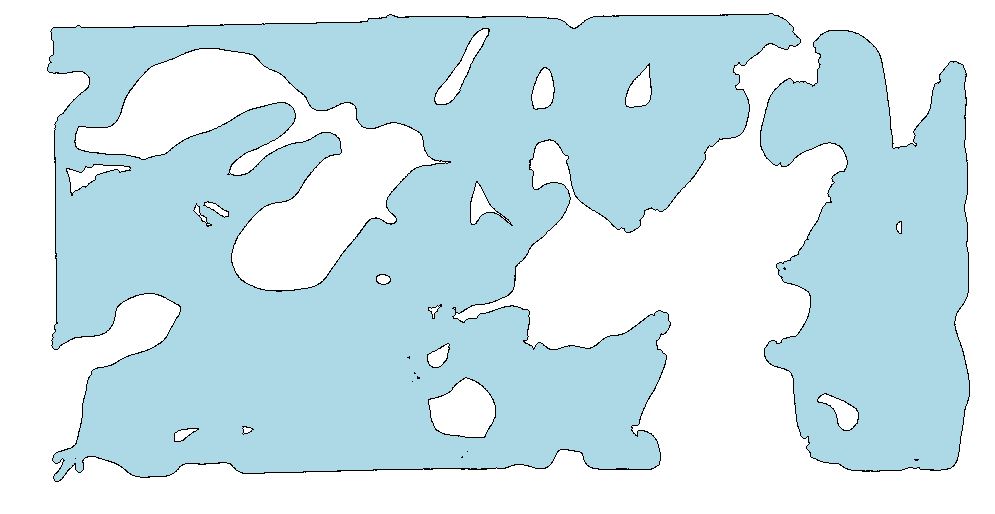
I have multiple point shapefiles with 20,000 - 100,000 points and I would like to create an outline/polygon from them using R. There may be holes in the middle of the polygon which I want outlined as well. I have posted pictures of how I want this to look. I have searched a lot for an answer to this using R and haven't found one that has worked. Many other examples I see don't follow the outline as closely as I would like. The polygon that I did get to work came from ArcGIS using the aggregate points (Cartography) tool with a 10 meter distance, but I want to use R.

    ye <- read.csv(ye1,header = F, stringsAsFactors = F)
    ye$gid <- 1
    new_names <- c("easting", "northing","lat","long","yield","moisture","swath","distance","flow","interval","agl","transect","gpstime","utmzone","rmcode","gid")
    names(ye) <- new_names
    
     ye_shp <- SpatialPointsDataFrame(ye[,1:2],data = ye,proj4string = CRS("+proj=utm +zone=14 +datum=NAD83 +units=m +no_defs +ellps=GRS80"))
        

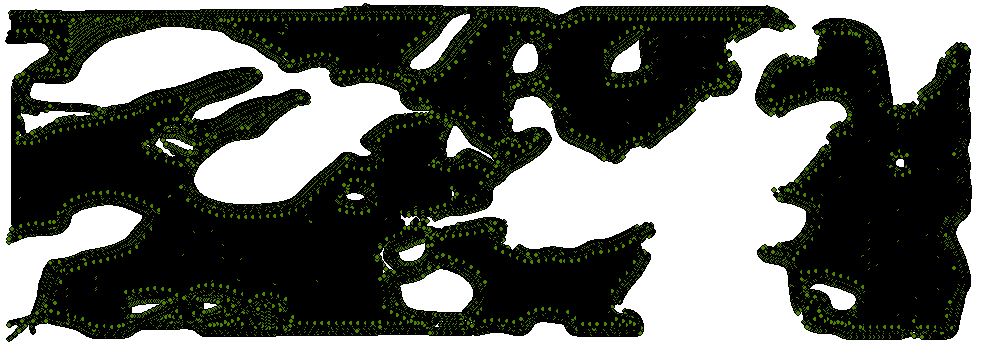
This is an agricultural field with 70,000+ points. enter image description here

This is what I want the polygon to look like. enter image description here

4
  • Starting from an arbitrary seed focus point you could try and find the nearest neighbors and connect the dots step by step. After connecting the nearest neighbor make it your next focus point and pop the last point from the queue of points. This won't work in all cases but it could give you a first spark? towardsdatascience.com/… Commented Jan 10, 2021 at 21:51
  • Are the black areas in the first image due to lots of overlapping point markers? What's all the green speckles near the edges? If it is overlapping markers then you could probably do a small circular buffer at each point and then dissolve to get something like the second image.
    – Spacedman
    Commented Jan 11, 2021 at 11:34
  • @Spacedman - The first image is a bunch of green dots (with a standard black outline). The is a point (dot) taken every 5 feet across this crop field so at the zoom level I took the screen shot it looks black. The green dots are just some points that must be positioned to where they actually show through, but they are the same as all the others. I will tried running the buffers on a single 24k point field and it ran for 10 minutes until I killed the program. Commented Jan 11, 2021 at 15:30
  • 1
    24,000 small point buffers created and merged should be quicker than that - can you edit your Q to show your R code you tried?
    – Spacedman
    Commented Jan 11, 2021 at 15:59

2 Answers 2

3

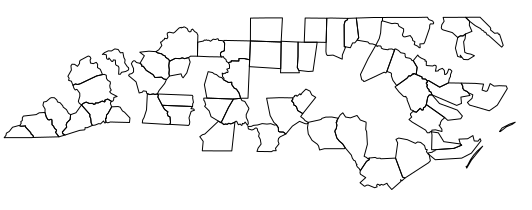
Let's see... First create a patchy set of regions a bit like yours by taking a random half of the nc dataset:

set.seed(123)
library(sf)
nc = st_read(system.file("shape/nc.shp", package="sf"))
reg = nc[sample(nrow(nc),nrow(nc)/2),]
reg = st_transform(reg,"EPSG:3857")
plot(reg)

enter image description here

and generate 24,000 points over it:

pts = st_sample(reg, 24000)
plot(pts, add=TRUE)

enter image description here

Now I'll do a merged approximate 5km buffer over the union of the points:

 system.time({b = st_buffer(st_union(pts), dist=5000)})
#   user  system elapsed 
# 34.249   0.404  34.658

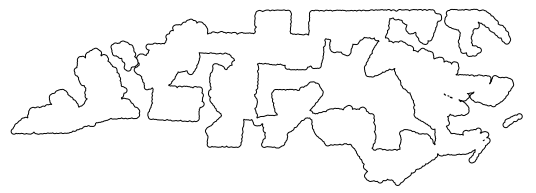
which takes 34 seconds on this 4 year old desktop, on a single core. The resulting polygon structure is like this:

 plot(b)

enter image description here

which looks like the thing you are after.

0
0

Thanks @Spacedman for the help.

I tried using gBuffer with on the SpatialPointsDataFrame. I initially had a user error by selecting the wrong csv columns for the coordinates. I think gBuffer had issues with coordinate system not using planar coordinates.

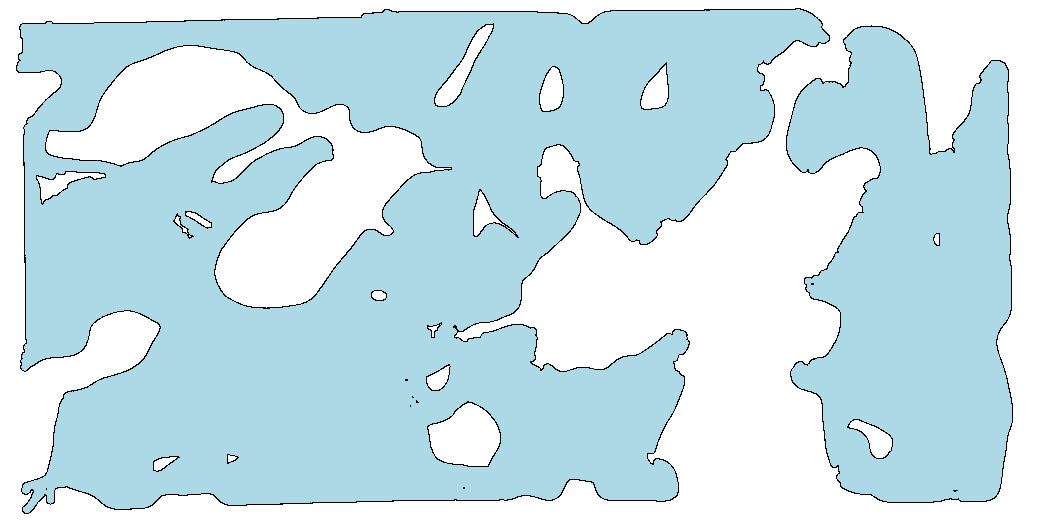
Comparing the run times, I went with @Spacedman answer. However, the gBuffer solution by also worked but was slower.

From @Spacedman

    ye <- read.csv(ye1,header = F, stringsAsFactors = F)
    ye_shp <- SpatialPointsDataFrame(ye[,1:2],data = ye,proj4string = CRS("+proj=utm +zone=14 +datum=NAD83 +units=m +no_defs +ellps=GRS80"))
  ye_shp <- st_as_sf(ye_shp)
   system.time({b = st_buffer(st_union(ye_shp), dist=7)})

for a 24k point file
   user   system elapsed 
  28.36    0.31   28.90 

for a 70k point file
  user  system elapsed 
 276.08   14.56  292.56 

enter image description here

gBuffer solution

    ye <- read.csv(ye1,header = F, stringsAsFactors = F)
    ye_shp <- SpatialPointsDataFrame(ye[,1:2],data = ye,proj4string = CRS("+proj=utm +zone=14 +datum=NAD83 +units=m +no_defs +ellps=GRS80"))

  system.time({x <- gBuffer(ye_shp,width = 7)})

for a 24k point file
   user  system  elapsed 
  25.68    0.63   26.53 

for a 70k point file
   user  system elapsed 
 473.14   16.02  493.63 

enter image description here

Your Answer

By clicking “Post Your Answer”, you agree to our terms of service and acknowledge you have read our privacy policy.

Not the answer you're looking for? Browse other questions tagged or ask your own question.