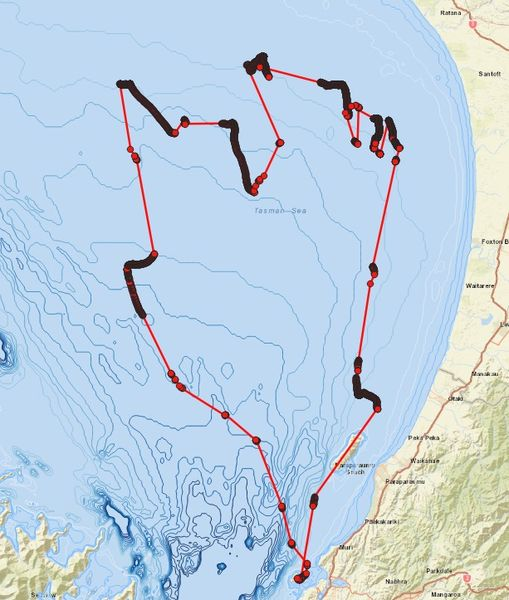
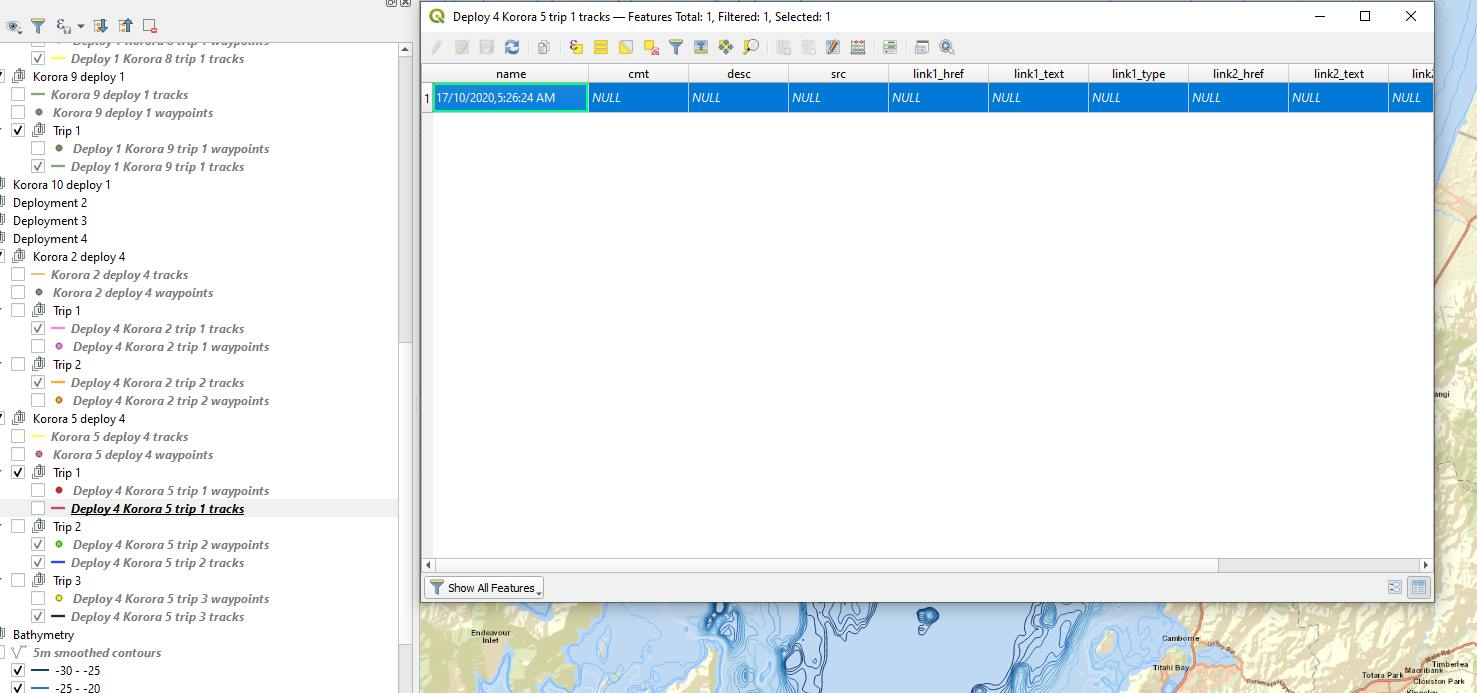
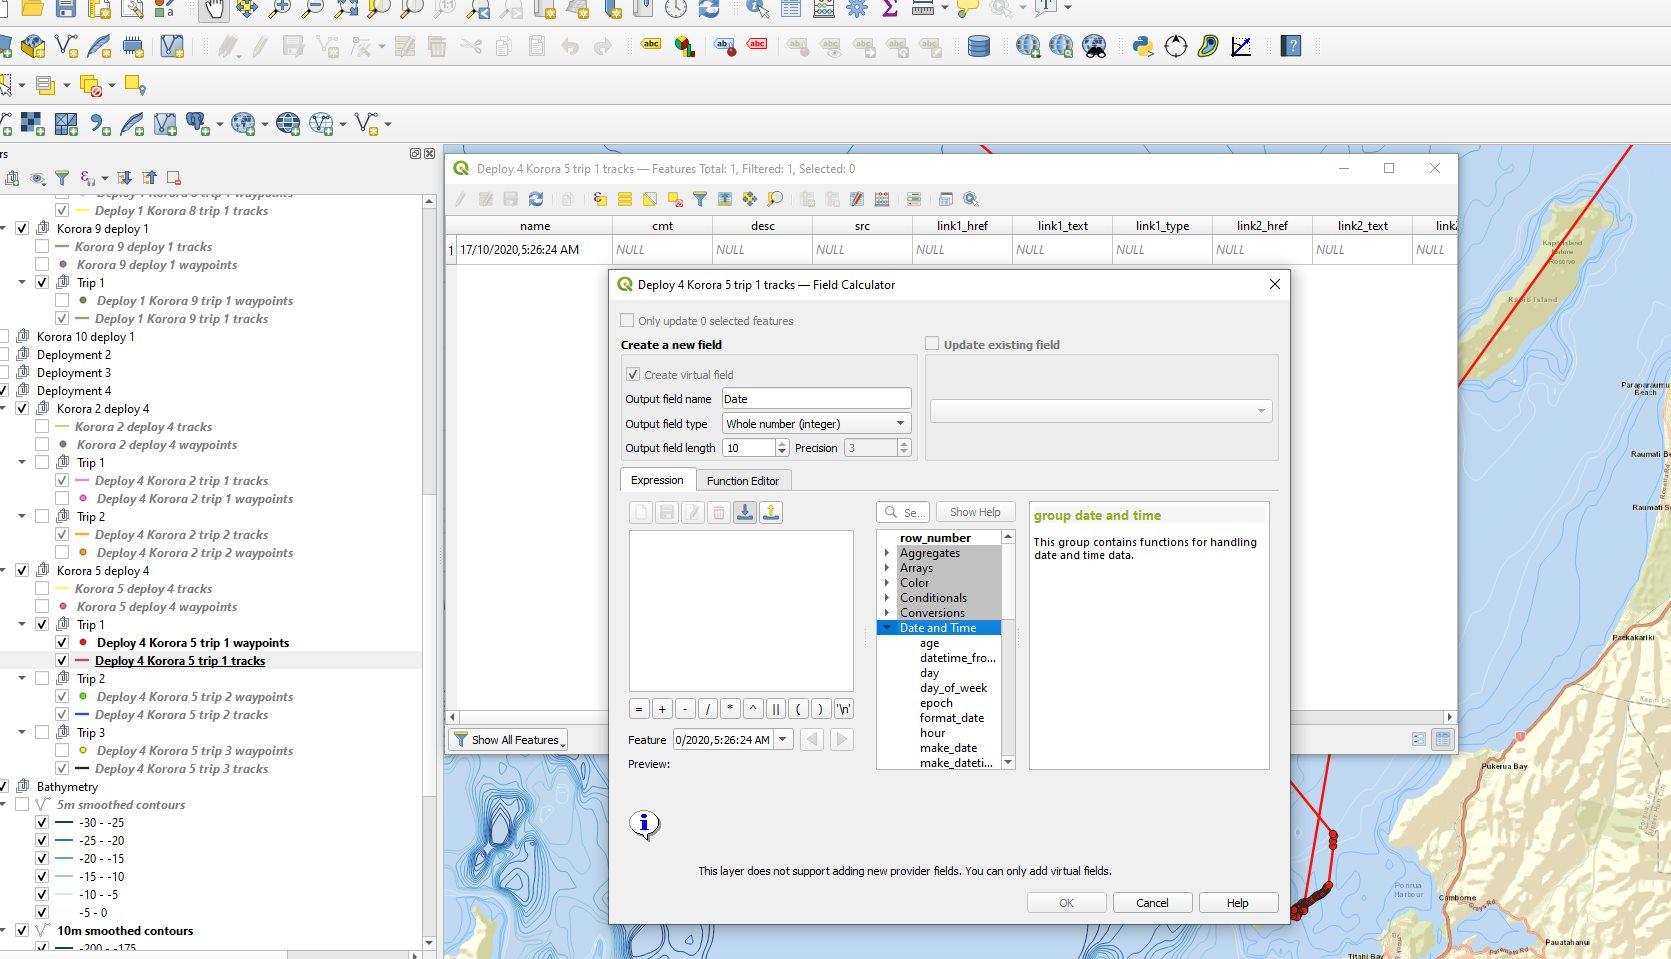
I'm trying to display different colours for each day spent at sea for each of my penguin tracks. Just wondering if anyone had any advice on how i could do that, for example this is an 8 day trip which i would like to be able to show using differnt colours to break it up. However, when i go to edit the track there are no attribute field for date, only for the GPS points. Also when i try to edit the layer the button is greyed out and it won't let me. I am new to using GIS software and i am not sure how to confidently do things yet, like how to use the attribute calculator. What i would like is for my track (the red line between the dots) to show a different colour for each day.
-
Your project looks interesting to me. I am pretty experienced with GIS/GPS and have some available time to provide you with volunteer assistance. Let me know if this might be of interest to you and we can continue the discussion outside of SE.– Stu SmithCommented Jul 3, 2021 at 15:36
-
Hi, yes that would be amazing as i am basically flying solo with my MSc research project and my supervisor can't really help me because he too has little expirience so it would be awsome to have someone knowledgable to consult with. @StuSmith– CourtneyCommented Jul 4, 2021 at 2:28
-
Great, let's start a discussion. I'm at [email protected]– Stu SmithCommented Jul 4, 2021 at 2:30
-
@Courtney from the image you added i can see there is a points layer "Waypoints". It might/should have the location data and timestamps. Check if it does, I can suggest another approach.– mapperxCommented Jul 5, 2021 at 8:07
Add a comment
|
1 Answer
You have one single feature for the whole of your line. However, you want to be able to access particular segments of the line and create individual attributes for them. To be able to do that, explode your line: see documentation for explode line.
Be sure to have your data in a file format that QGIS can edit. GPX files are not really editable. I advise you saving it as Geopackage file.


