0

I would like to create a function where the cumulative precipitation (sum) of every n days is added to the ImageCollection. I'm using CHIRPS. Essentially, one should be able to do this for multiple days, so resulting in an imageCollection with for example 3 bands of the precipitation sum every 5, 10 and 20 days.

My approach right now is obviously not working, but I hope it displays where I'm going for.

var geometry = 
    /* color: #d63000 */
    /* displayProperties: [
      {
        "type": "rectangle"
      }
    ] */
    ee.Geometry.Polygon(
        [[[-131.06905651111887, 50.47632999698667],
          [-131.06905651111887, 23.187753129057395],
          [-54.340540886118866, 23.187753129057395],
          [-54.340540886118866, 50.47632999698667]]], null, false);

// Define region of interest
var adm_data = ee.FeatureCollection("FAO/GAUL/2015/level0")
var country = 'United States of America'
var roi = adm_data.filter(ee.Filter.inList('ADM0_NAME', [country]))
var roi = geometry

Map.addLayer(roi, {}, 'roi', false)

var roi = roi // or roi_country when anaylsing one country

/// Set time
var startdate = '2020-01-01' // insert
var enddate = '2021-01-01' // insert

// Products
var nDays = function(imageCollection, n){
  return function (image){
  currentDate = ee.Date(image.get('system:time_start'));
  nextDate = currentDate.advance(-n, 'day')
  var Precipitation = ee.ImageCollection("UCSB-CHG/CHIRPS/DAILY")
  .filterDate(startdate, enddate)
  .filterBounds(roi)
  .sum()
  return image.addBands('every_'+n+'days')
  } 
}

// Add a band with the precipitation sum every n days. How?? Any help much appreciated!
var p = nDays(ee.ImageCollection("UCSB-CHG/CHIRPS/DAILY"), 5)
print(p)

Link to the code: https://code.earthengine.google.com/51a533f812b337f82d5c1bc6f9b21fb6

1 Answer 1

1

Your date range has 366 days and you want to group by 5, 10 and 20 days (74, 37 and 19 element in each series; respectively). So, it is not very convenient to calculate the cumulative precipitation (sum) of every 5, 10 or 20 days and added them to each image of the ImageCollection. It is preferable to calculate each series as separate collections.

For my approach, I converted your ImageCollection (366 images) in a list of Images because it has a slice method for easily selecting by groups of 5, 10 or 20 images (as 366 is not divisible by 5, 10 or 20; last group in each series has 1, 6, and 6 images; respectively).

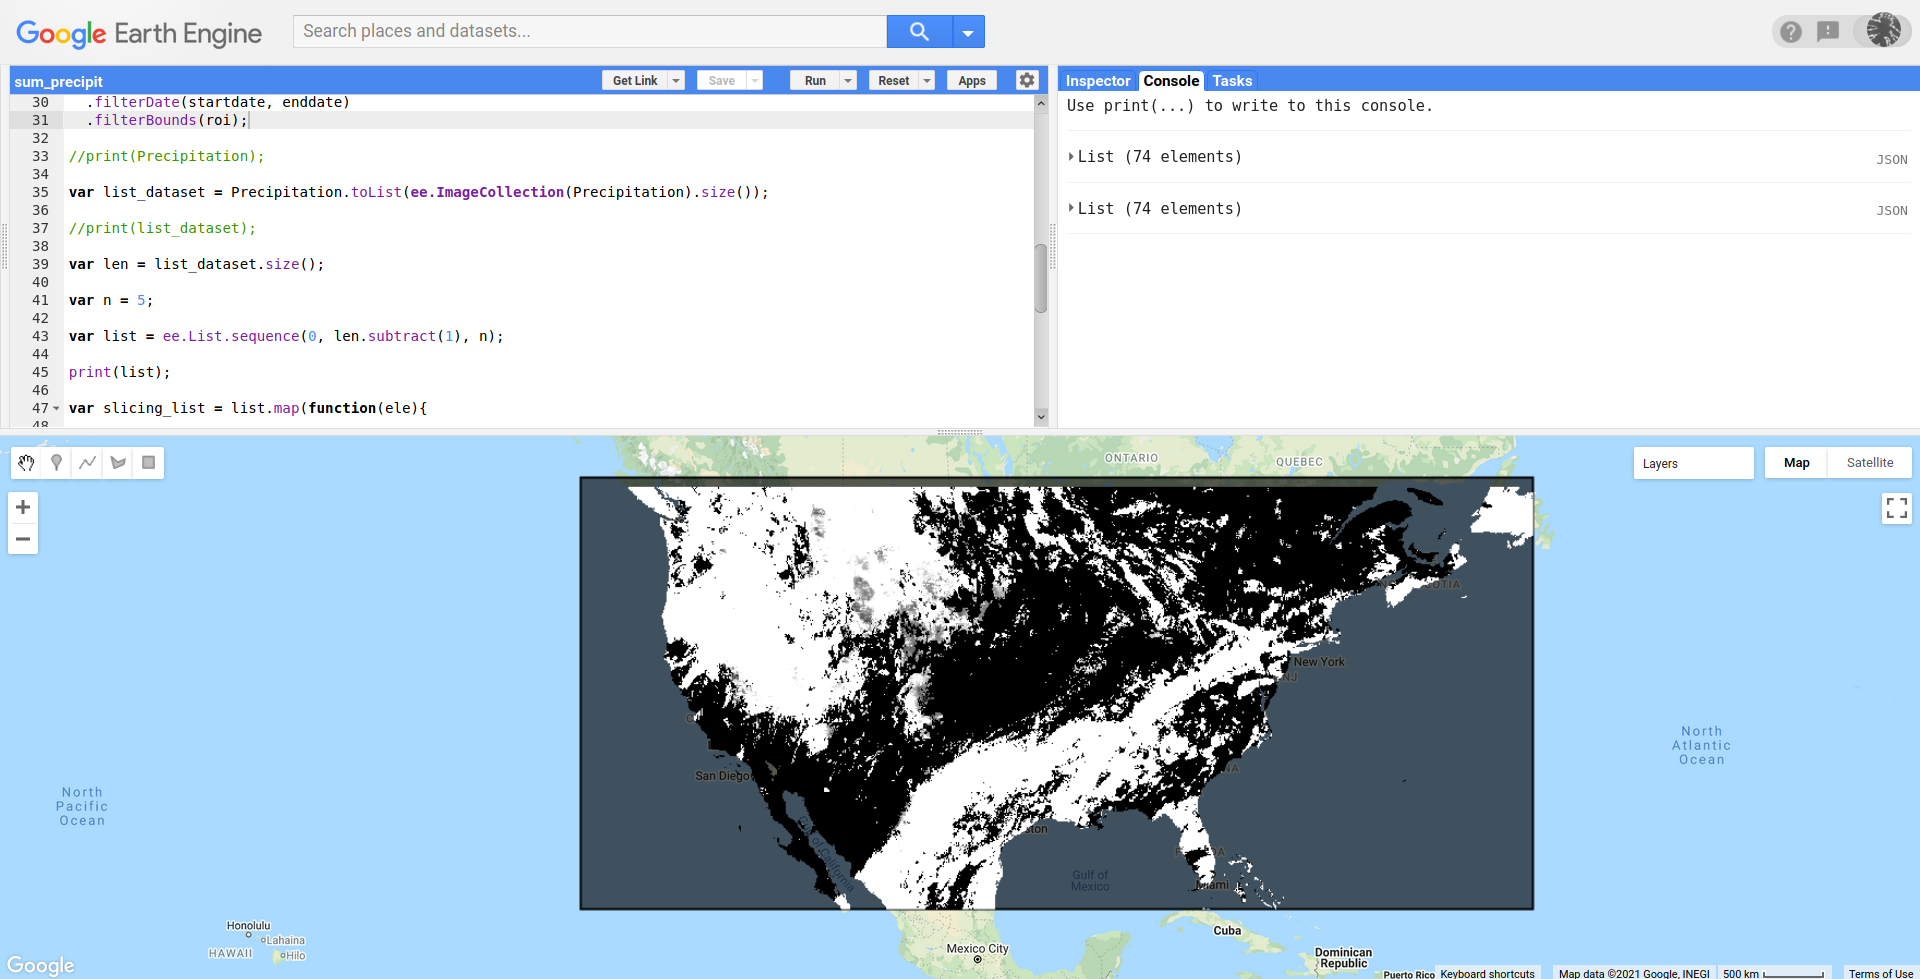
In code below, my function slices the list of images in groups of 5 and calculates the sum for each group before returning each one as a list of images. For grouping in 10 or 20 images only it is necessary to change n for corresponding value. It was used the same roi as in your code. For verification purpose, it was also added to canvas of GEE the first image of these 74 elements (grouped by 5).

var geometry = 
    /* color: #d63000 */
    /* displayProperties: [
      {
        "type": "rectangle"
      }
    ] */
    ee.Geometry.Polygon(
        [[[-131.06905651111887, 50.47632999698667],
          [-131.06905651111887, 23.187753129057395],
          [-54.340540886118866, 23.187753129057395],
          [-54.340540886118866, 50.47632999698667]]], null, false);

// Define region of interest
var adm_data = ee.FeatureCollection("FAO/GAUL/2015/level0");
var country = 'United States of America';
var roi = adm_data.filter(ee.Filter.inList('ADM0_NAME', [country]));
var roi = geometry;

Map.addLayer(roi, {}, 'roi');
Map.centerObject(roi);

var roi = roi; // or roi_country when anaylsing one country

/// Set time
var startdate = '2020-01-01'; // insert
var enddate = '2021-01-01'; // insert

var Precipitation = ee.ImageCollection("UCSB-CHG/CHIRPS/DAILY")
  .filterDate(startdate, enddate)
  .filterBounds(roi);
  
//print(Precipitation);

var list_dataset = Precipitation.toList(ee.ImageCollection(Precipitation).size());

//print(list_dataset);

var len = list_dataset.size();

var n = 5;

var list = ee.List.sequence(0, len.subtract(1), n);

print(list);

var slicing_list = list.map(function(ele){
  
  var start = ee.Number(ele).int(); 
  var end = ee.Number(ele).add(n).int(); 
  
  var new_list = ee.List([]);
  var element = ee.List(list_dataset.slice(start, end));
  
  element = ee.ImageCollection(ee.List(element)).sum();
  
  new_list = new_list.add(element);
  
  return new_list;

}).flatten();

print(slicing_list);

var first_img = slicing_list.get(0);

Map.addLayer(ee.Image(first_img).clip(roi));

After running above code in GEE code editor, result looks as follows.

enter image description here

Your Answer

By clicking “Post Your Answer”, you agree to our terms of service and acknowledge you have read our privacy policy.

Not the answer you're looking for? Browse other questions tagged or ask your own question.