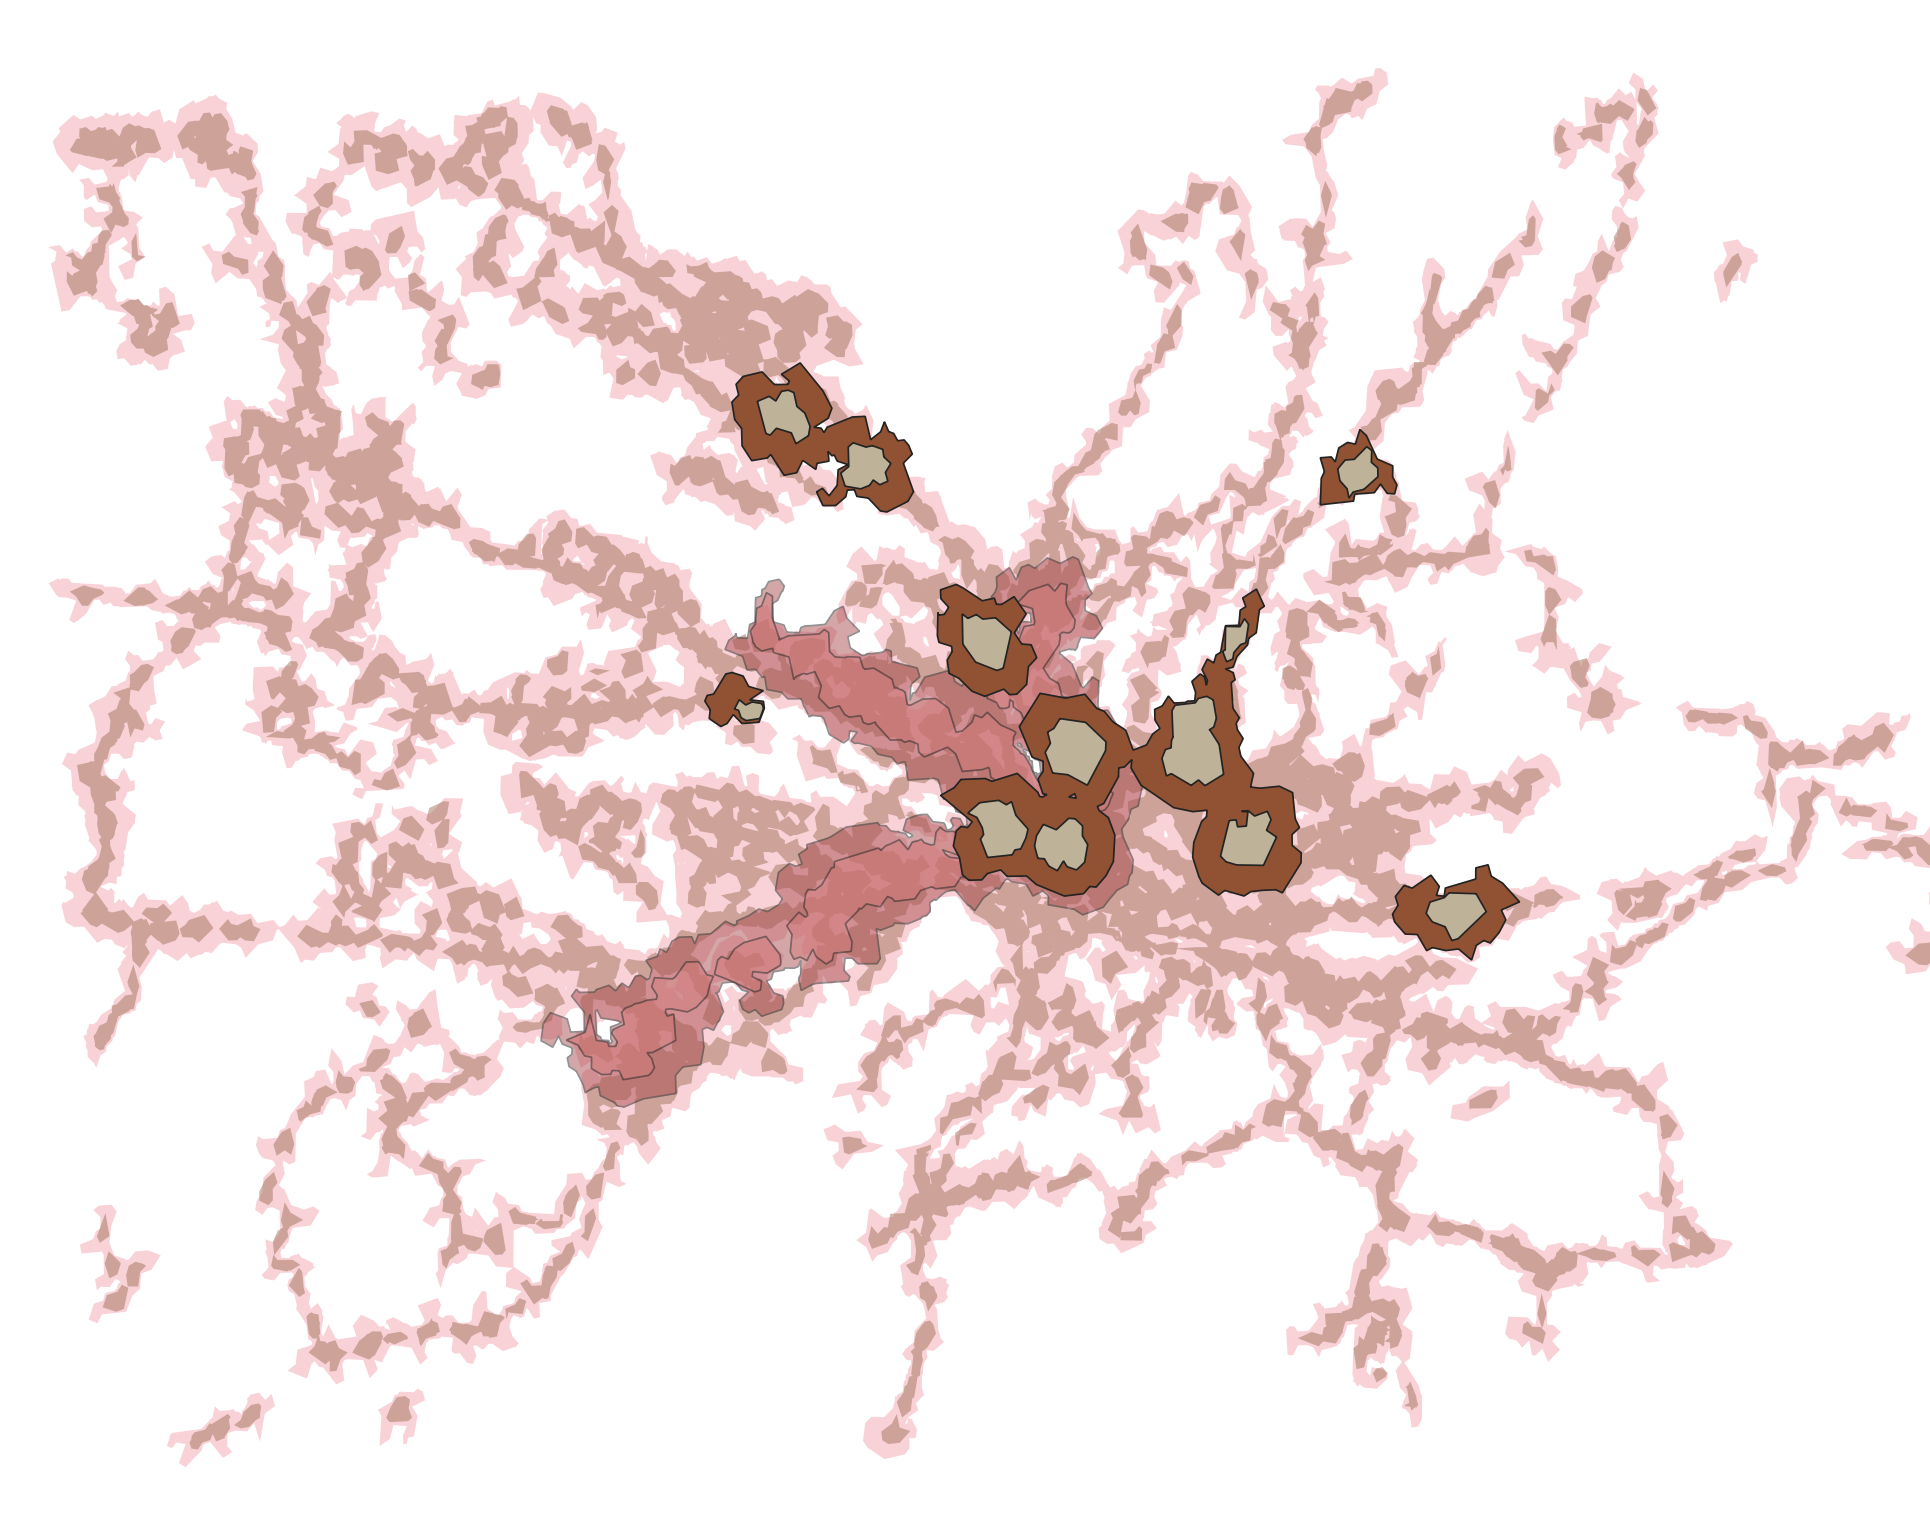
I have created a series of isochrones for public transport, for the bus, tram and train, with a 5 and 10 minute walking range. Now I would like to aggregate these values to show which areas are most accessible.
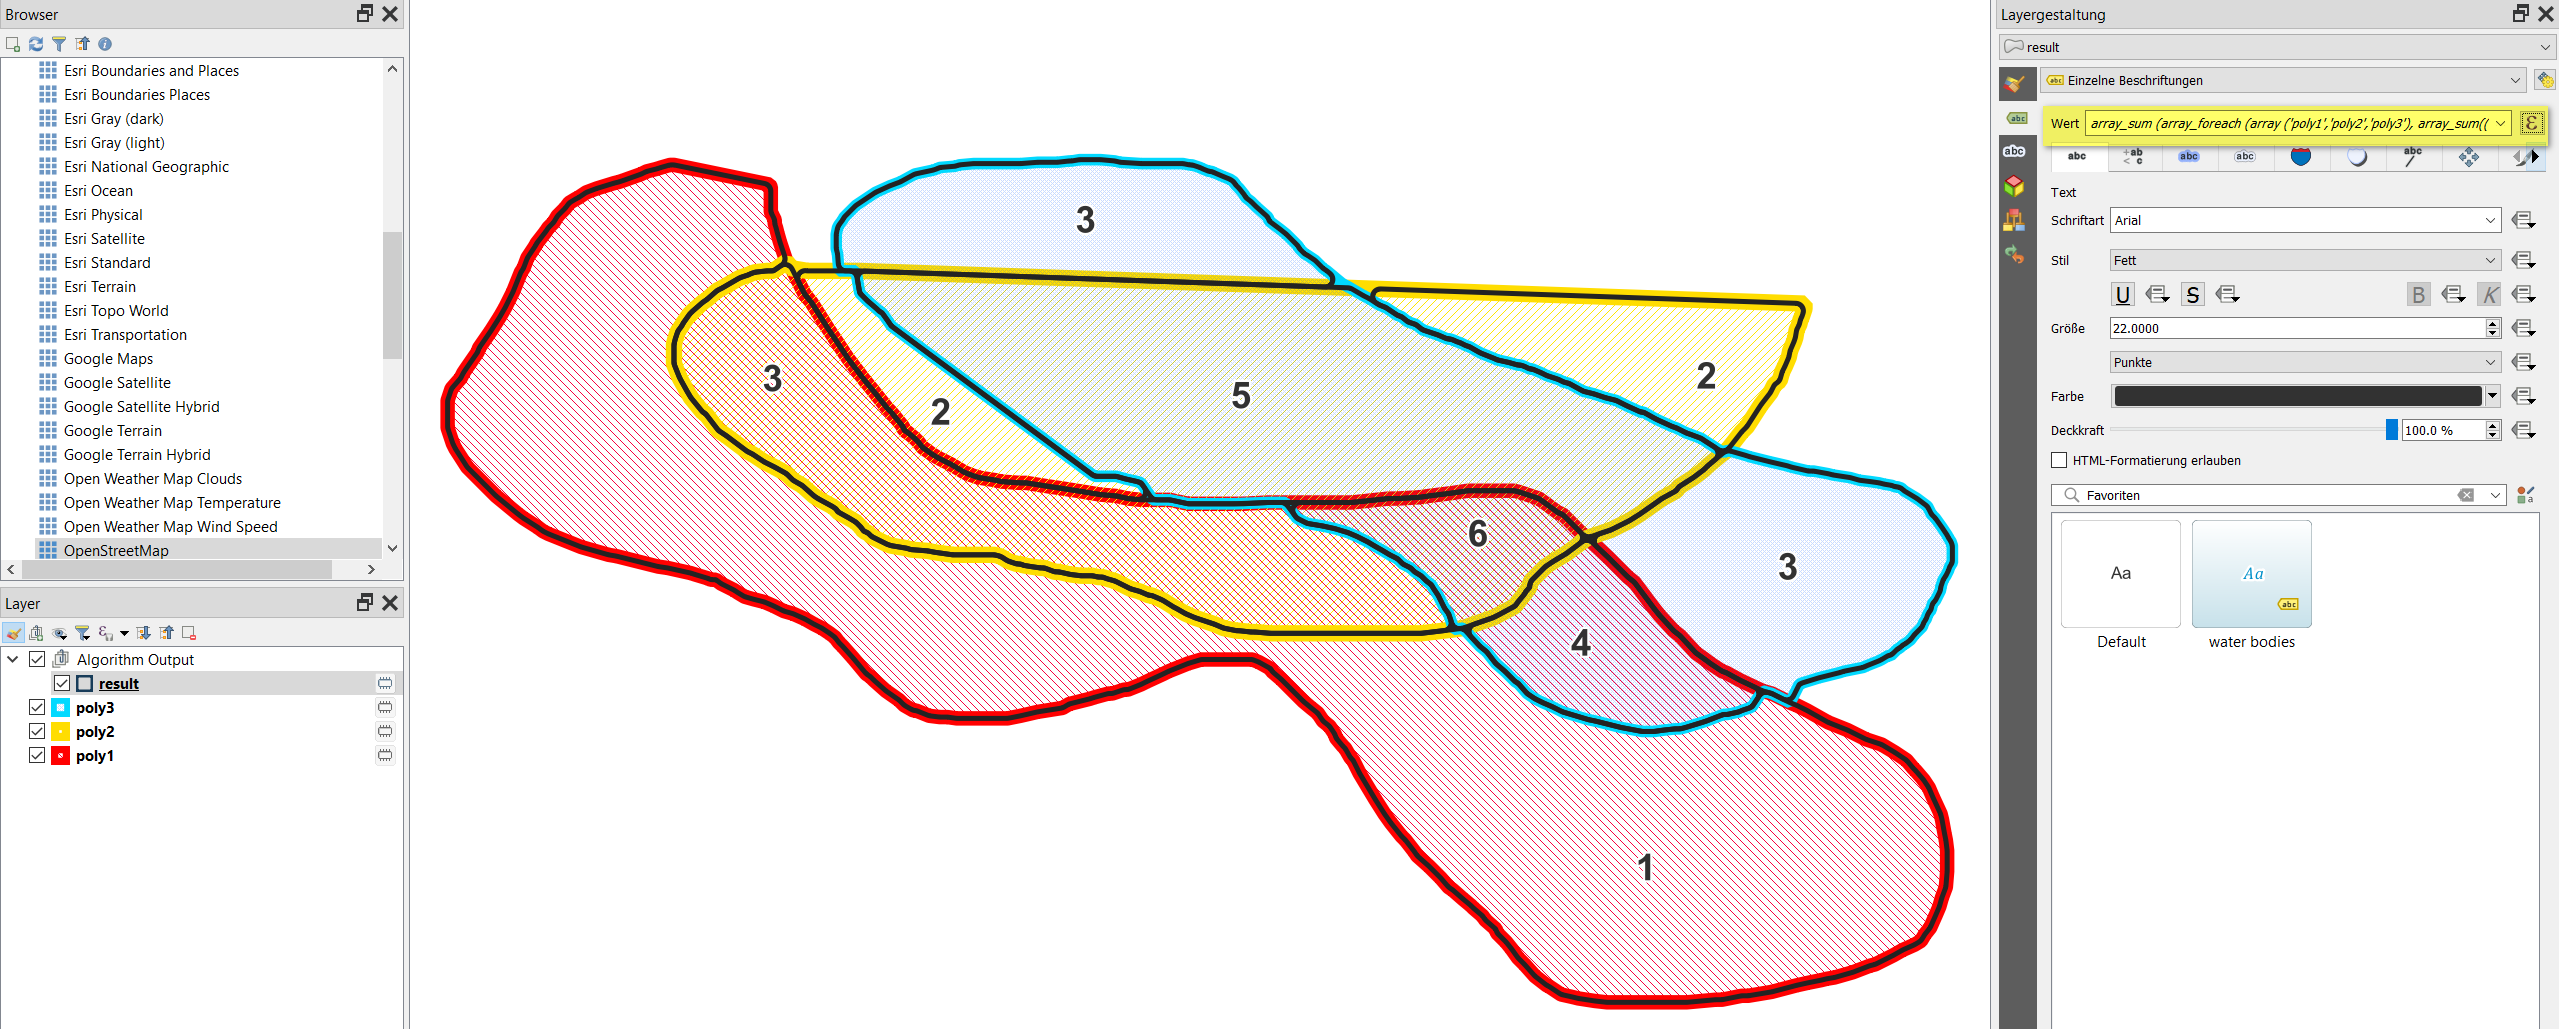
I have assigned 1-6 values for each of these layers, which I would then like to aggregate, for instance, 5 minutes access to a train station has the value of 6, but when it would be accessible by tram within 5 minutes, the shape should get an even higher value. How could this be achieved?


