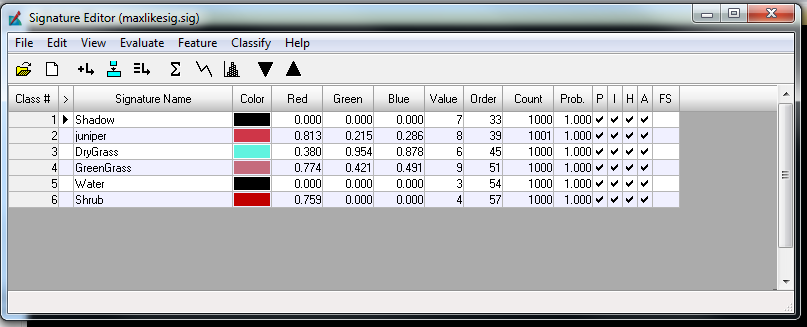
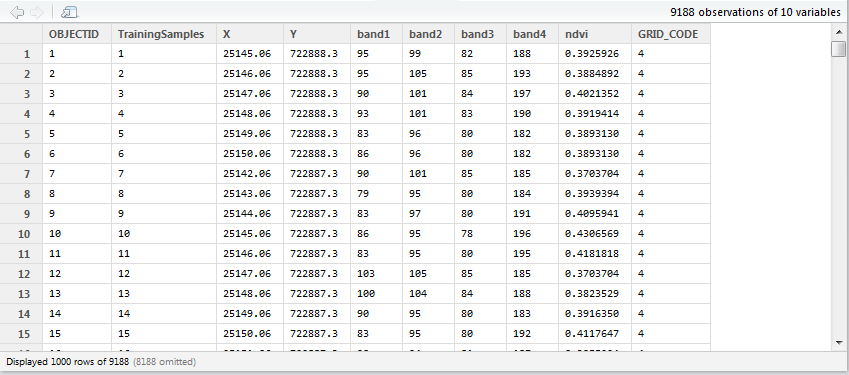
I am working with Erdas Imagine's Signature Editor to perform maximum likelihood classification. I need to use the same training set created in Erdas for other classification using R. Is there a way to extract the raster band pixel values under the .aoi polygons and export that information to a .txt or .csv? I am looking for the same functionality as the ArcGIS Sample tool where the individual raster band pixel values are extracted underneath points and written to a table (e.g. Figure 2). Alternatively, is it possible to export the signature editor table (i.e. including R,G,B,NIR bands and the class label) to a .csv? Any workarounds on how to integrate Erdas's signature editor with the analytical functionality of R would be very helpful.
For example, I need the functionality of the signature editor
Figure1

Yet I need to convert these values to a format that I can read into R. Note that I need all four bands of the input image along with a class ID (i.e. grid code). This table was generated in ArcGIS.
Figure 2

