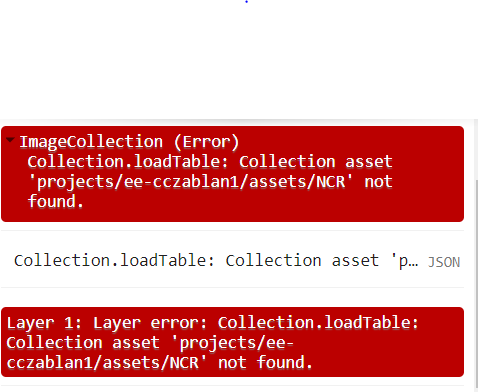
I've been trying to export the quarterly mean surface temperature derived from Landsat-8. I stumbled upon the batch module of fitoprincipe's. However instead of exporting a single image for each quarter, it exports multiple empty images. Can someone help me figure this out?
var batch = require('users/fitoprincipe/geetools:batch');
// This example demonstrates the use of the Landsat 8 Collection 2, Level 2
// QA_PIXEL band (CFMask) to mask unwanted pixels.

function maskL8sr(image) {
  // Bit 0 - Fill
  // Bit 1 - Dilated Cloud
  // Bit 2 - Cirrus
  // Bit 3 - Cloud
  // Bit 4 - Cloud Shadow
  var qaMask = image.select('QA_PIXEL').bitwiseAnd(parseInt('11111', 2)).eq(0).copyProperties(image, ['system:time_start']);
  var saturationMask = image.select('QA_RADSAT').eq(0).copyProperties(image, ['system:time_start']);

  // Apply the scaling factors to the appropriate bands.
  var opticalBands = image.select('SR_B.').multiply(0.0000275).add(-0.2).copyProperties(image, ['system:time_start']);
  var thermalBands = image.select('ST_B.*').multiply(0.00341802).add(-124.15).copyProperties(image, ['system:time_start']);

  // Replace the original bands with the scaled ones and apply the masks.
  return image.addBands(opticalBands, null, true)
      .addBands(thermalBands, null, true)
      .updateMask(qaMask)
      .updateMask(saturationMask)
      .copyProperties(image, ['system:time_start']);
}

// Map the function over one year of data.
var collection = ee.ImageCollection('LANDSAT/LC08/C02/T1_L2')
                     .filterDate('2016-01-01', '2021-12-31')
                     .map(maskL8sr);

var composite = collection.mean();

// Display the results.
Map.setCenter(120.9854, 14.5994,10);  // Metro Manila
Map.addLayer(composite.select('ST_B10').clip(table), {min: -10, max: 50, palette: 'blue,green,yellow,orange,red'});

// // Chart time series of LST for Uganda in 2015.
// var ts1 = ui.Chart.image.series({
//   imageCollection: collection.select('ST_B10'),
//   region: table,
//   // reducer: ee.Reducer.mean(),
//   scale: 100,
//   xProperty: 'system:time_start'})
//   .setOptions({
//     title: 'LST 2015 Time Series',
//     vAxis: {title: 'LST Celsius'}});
// print(ts1);

var start = ee.Date('2016-01-01');
var end = ee.Date('2021-12-31');
var numbQuarters = end.difference(start, 'month').divide(3).ceil();

// make a composite image for every quarter
var quarterlyImages = ee.ImageCollection.fromImages(
            ee.List.sequence(1, numbQuarters).map(
              function(quarter){
              var startTemp = start.advance(
                              ee.Number(quarter).subtract(1).multiply(3), 'month');
              var endTemp = start.advance(ee.Number(quarter).multiply(3), 'month');
              var image = collection.filterDate(startTemp, endTemp)
                                    .filterBounds(table)
                                    .mean()
                                    .clip(table)
                                    .select('ST_B10');
              return image.set('system:time_start', startTemp.millis(),
                               'system:time_end', endTemp.millis());
            }));
print(quarterlyImages);


batch.Download.ImageCollection.toDrive(quarterlyImages, 'Quarterly Folder',
                {name: 'LST_{system:index}',
                  scale: 30});
Here's the code.


