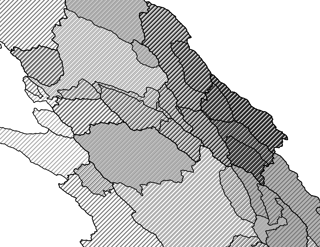
I'm attempting to extract NBR mean value from MODIS data based on a set of polygons. The polygon set has overlapping everywhere (don't blame me, it's not my work nor my idea). The shapefile is something like this (where darker zones have many overlapping polygons):
With R, my approach would be using extract or exact_extract which resolves this issue, but commuting Normalized Burn Ratio is slow for the size of the study area. In Python, one approach could be rasterstats over a rasterio object. But what about rioxarray?
There is a tutorial using polygons for zonal statistics in geocube's documents, but this function doesn't work for overlapping polygons.
So far my code is simple but effective, I'm missing this key part
import os
import rioxarray as rioxr
from rioxarray.merge import merge_arrays
from glob import glob
import geopandas

polys = geopandas.read_file(path_to_polygons)

files = glob(os.path.join('path/to/MOD13Q1/2002/033','*.hdf')) # example path
nbr_single = []
for file in files:
    with rioxr.open_rasterio(file) as src:
        NIR = getattr(src,'250m 16 days NIR reflectance')
        MIR = getattr(src,'250m 16 days MIR reflectance')
        nbr_single.append((NIR-MIR)/(NIR+MIR))
nbr_mosaic = merge_arrays(nbr_single)
One approach is looping over each polygon, clipping and computing zonal statistics, but with +400 polygons the process is slow enough for looking a better approach.
With a rioxarray object, is there a way to extract statistics from polygon shapes similar to zonal statistics (like zone mean or sum) but using overlapping polygons?

