5

I'm trying to plot a categorical terra raster object with an explicit colour for each level, like you'd do with a land cover raster, but running into problems when the raster doesn't have every level of the factor in it.

First create a raster with numeric values 1 to 10, make categorical, and plot:

r2 = rast(matrix(1:10,2,5))
r2 = as.factor(r2)
levels(r2) = data.frame(value=1:10, desc=paste0("L",1:10))
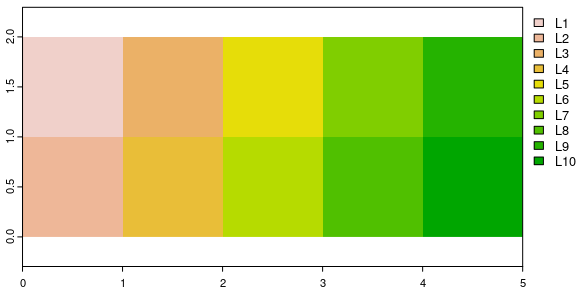
plot(r2)

enter image description here

Great, now I want to plot with every odd level coloured red and every even level coloured blue, so I make a palette of length 10:

rb = rep(c("red","blue"),5)
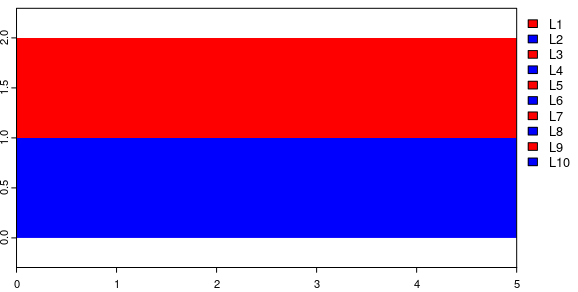
plot(r2, col=rb)

enter image description here

Great, but suppose my raster doesn't have every level? For example, let's make a copy of the raster and set the first cell into a level 2:

r2c = r2
r2c[1] = 2
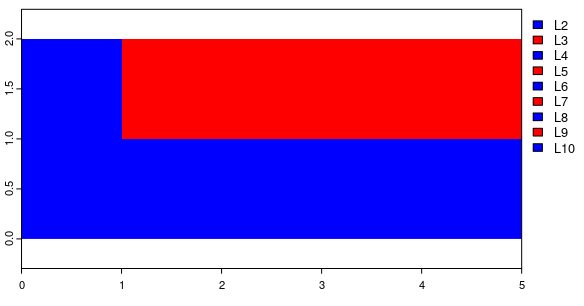
plot(r2c, col=rb)

enter image description here

And now the colours have flipped and its not alternating with the 10 factor levels any more. Level 10 (blue) is not the same colour as level 8 (red).

I think what is happening is that the colour specifies colours for all values that exist in the raster, not all values that exist in the levels. So if I drop the first element of the palette (because there's no level 1 in the raster any more) I get this:

plot(r2c, col=rb[-1])

enter image description here

which is what I'm after. But this is a problem, because it means whenever I have a colour map that contains values that aren't in the raster (because maybe its a crop from a larger set), I have to subset the colour palette according to which values are still present in the cropped raster. I can't find a simple way to say "L10" is "blue", and "L3" is "yellow" and so on. Or have I missed it?

Edit: the solution might be in coltab but I think that requires making a full 255-row colour palette. Doable, but not neat.

2 Answers 2

7

coltab is not as painful as it may seem (the docs are a bit behind the facts). You can do

r2 = rast(matrix(1:10,2,5))
r2 = as.factor(r2)
levels(r2) = data.frame(value=1:10, desc=paste0("L",1:10))
# first color-table value is zero, so starting with "blue"
coltab(r2) = rep(c("blue", "red"), 6)
plot(r2)

And the colors now stay the same

r2c = r2
r2c[1] = 2
plot(r2c)

Nevertheless, your point remains valid. It would be useful to have stable color/class combinations by linking the colors to the known levels, whether they are present or not. I have now implemented that in terra version 1.5-50.

With that version, you can also set a color table by ID

library(terra)
r <- rast(ncols=3, nrows=2, vals=c(10:12, 23:25))
coltab(r) <- data.frame(values=c(10:12, 23:25), cols=rainbow(6))
plot(r)

And that should become the canonical approach, I think, as it is the clearest and most flexible way to do it.

2
  • I think the problem with coltab is that it requires entries for rows 0 to max(r), which is awkward when my numeric values are 37 codes spread out in the range 0 to 255 (eg the 1-5 are various water classes, 100-105 are forest classes, 200-206 are agriculture, etc). Given a data frame with only 37 rows (of value, desc, colour) I need to splay that out into 255 rows to use in a coltab?
    – Spacedman
    Commented Jul 1, 2022 at 22:27
  • 1
    fair enough, see appended answer Commented Jul 1, 2022 at 23:05
5

see a solution using ggplot and tidyterra. You may need to use drop = FALSE on the scale_fill_* call:

library(terra)
#> terra 1.5.21
library(tidyterra)
#> ── Attaching packages ────────────────────────────────── tidyterra 0.1.0.9002 ──
#> 
#> Suppress this startup message by setting Sys.setenv(tidyterra.quiet = TRUE)
#> ✔ tibble 3.1.7     ✔ dplyr  1.0.9
#> ✔ tidyr  1.2.0
r2 = rast(matrix(1:10,2,5))
r2 = as.factor(r2)
levels(r2) = data.frame(value=1:10, desc=paste0("L",1:10))


library(ggplot2)
#> 
#> Attaching package: 'ggplot2'
#> The following object is masked from 'package:terra':
#> 
#>     arrow
rb = rep(c("red","blue"),5)


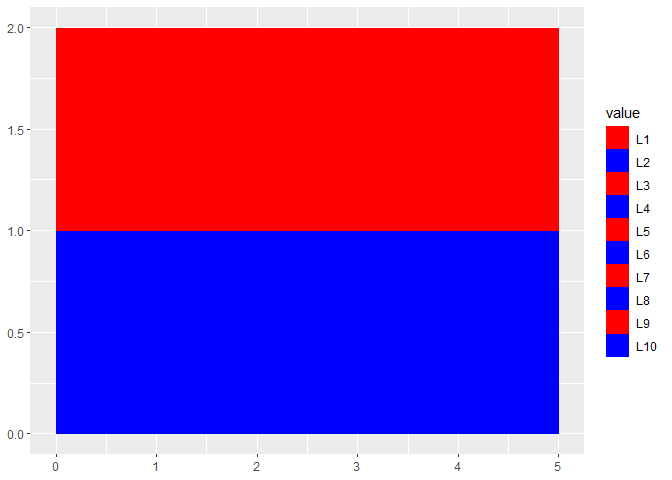
ggplot() +
  geom_spatraster(data=r2) +
  scale_fill_manual(values = rb)


r2c = r2
r2c[1] = 2


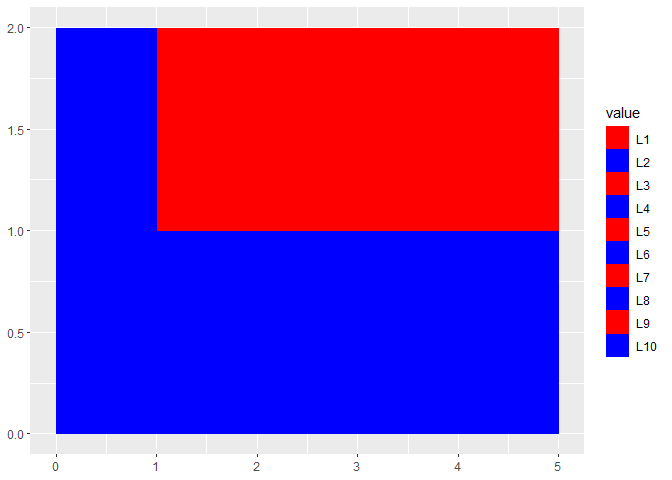
ggplot() +
  geom_spatraster(data=r2c) +
  scale_fill_manual(values = rb, drop = FALSE)

Created on 2022-07-02 by the reprex package (v2.0.1)

1
  • 1
    I don't think proposing a completely different graphics system fixes a problem with the plot function.
    – Spacedman
    Commented Jul 2, 2022 at 8:42

Your Answer

By clicking “Post Your Answer”, you agree to our terms of service and acknowledge you have read our privacy policy.

Not the answer you're looking for? Browse other questions tagged or ask your own question.