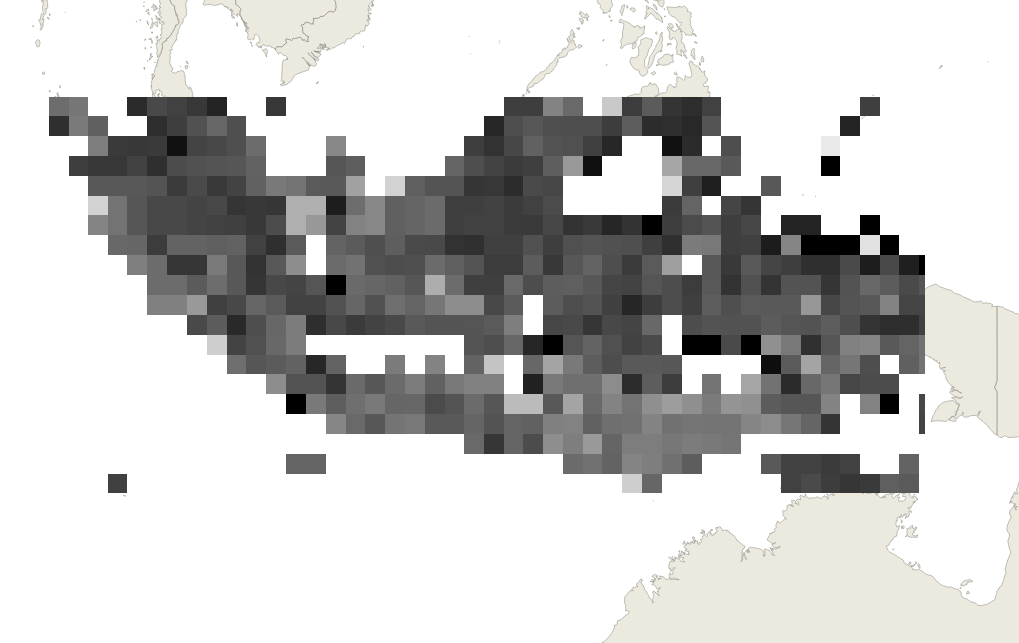
Figured out the solution.
The problem is that when you apply a "reduce" operation across multiple ee.Images in GEE, GEE produces an output image which is not in the original ee.Images' projections, but rather in the default GEE projection, EPSG:4236. It also sets the "scale" of the resulting image to the default "scale" of EPSG:4236, which is 1 degree (approximately 111 km at the equator)--even though the input ee.Images, and thus the output ee.Image, are actually at higher resolution. When you run Export.image.toDrive, GEE will write an image with resolution equal to the "scale" of the projection of the output image.
The solution is to manually overwrite the output image with the correct "scale", i.e. the scale of the input images.
The key line is:
//We have to manually set the scale of the output back to 231 meters
minn = minn.setDefaultProjection(minn.projection(), null, 231);
Code illustrating this procedure:
//////////////////////////
//Define boundary box for Indonesia to clip data to:
//All of Indonesia
var geomPoly = ee.Geometry
.BBox(85, -12, 145, 8);

//Center viewer on area of interest
//Coordinates are longitude, latitude, zoom level
//Can also pass in a geometry object e.g.
//var geometry = ee.Geometry.Point([130,05])
// Map.setCenter(130, -5,4);
Map.centerObject(geomPoly);

//Want to see this on satellite background
Map.setOptions('SATELLITE');


////////////////////////////////////////
//Get Modis EVI data betwen specified dates,
//clip to Indonesia, download

//Image collection consists of multiple images at different
//times and locations and possibly variables.
//Collect data over a year to take quantiles
var prior_year = "2002";
var current_year = "2003";
var startdate = prior_year + "-10-16";
var enddate = current_year + "-10-15";

//Pull in Modis MOD13Q1 Vegetation Indices, 250m.
// https://developers.google.com/earth-engine/datasets/catalog/MODIS_061_MOD13Q1
// https://www.sciencedirect.com/science/article/pii/S0034425702000962
// The Mod13Q1 data are temporal composites of 16-day periods created
// by selecting the best cloud-free and close-to-nadir observations

var evi_coll = ee.ImageCollection('MODIS/061/MOD13Q1')
  .filterDate(startdate, enddate)
  .select("EVI");

print("MODIS EVI", evi_coll);
print("Modis EVI projection: ", evi_coll.first().projection());

//MODIS EVI comes in at 231m resolution (approximately)
print("MODIS EVI resolution: ", evi_coll.first().projection().nominalScale());

//Create quantile composites (converts from imageCollection to Image)
var almostMinMax = ee.Reducer.percentile([2,98],["min","max"])

//Run a reducer which takes a collection of images and takes
//(pixel by pixel) the 98th and 2nd percentiles.
var extrema = evi_coll.reduce(almostMinMax);

//Annoyingly, applying a Reducer tags the output image as EPSG:4236
//with 1 degree scale even though it's not actually in that projection
//or resolution, and must be manually overwritten.
// https://gis.stackexchange.com/questions/428384/whats-correct-order-of-resampling-reprojecting-and-composing-imagecollection-i
// https://developers.google.com/earth-engine/apidocs/ee-image-setdefaultprojection

print("Extrema: ", extrema);

var minn = extrema.select("EVI_min")
.clip(geomPoly);

//We have to manually set the scale of the output back to 231 meters
minn = minn.setDefaultProjection(minn.projection(), null, 231);

var maxx = extrema.select("EVI_max").clip(geomPoly)
.clip(geomPoly);

//Manually setting scale here also (another output of the reduce)
maxx = maxx.setDefaultProjection(maxx.projection(), null, 231);

print("Minn: ", minn);
print("Maxx: ", minn);

print("Minn native resolution: ", minn.projection().nominalScale());

//Take differences between the max and min to get a delta:
var evi_diff = maxx.subtract(minn).clip(geomPoly);

print("EVI diff: ", evi_diff);

//The nominal scale is now correctly set back to 231 meters
print("EVI diff native resolution: ", evi_diff.projection().nominalScale());


//////////////////////////////
//Visualize and export resulting data

var projection=evi_diff.projection().getInfo();

//Recommended colorization from page:
//https://developers.google.com/earth-engine/datasets/catalog/MODIS_MOD09GA_006_EVI
var colorizedVis = {
  min: 0.0,
  max: 8000,
  palette: [
    'FFFFFF', 'CE7E45', 'DF923D', 'F1B555', 'FCD163', '99B718', '74A901',
    '66A000', '529400', '3E8601', '207401', '056201', '004C00', '023B01',
    '012E01', '011D01', '011301'
  ],
};


//Color scheme for visualizing the difference in EVI, which has a different scale.
var diffVis = {
  min: -1000.0,
  max: 5000.0,
  palette: [
    "ffffff","ce7e45","df923d","f1b555","fcd163",
    "99b718","74a901","66a000","529400","489b01",
    "33b602","09ab02","009b00","036602","025802",
    "024702","044d04"],
};

//Add the images to the map using the visualization scheme.
Map.addLayer(minn, colorizedVis, "Trough");
Map.addLayer(maxx, colorizedVis, "Peak");
Map.addLayer(evi_diff, diffVis, "Diff");

//Nominal scale will now be correct
var scale = evi_diff.projection().nominalScale().int();

print("Scale: ", scale);

//True scale of output image.
var myscale = 230;

// Export image to Google Drive. Not automatic,
// have to hit a button under "Tasks" on the right.
Export.image.toDrive({
  image: evi_diff,
  description: "modis_scale_" + myscale.toString() + "_epsg_evi_diff_" + startdate + "_" + enddate,
  region: geomPoly,
  crs: projection.crs,
  scale: myscale,
  maxPixels: 1e13,
  crsTransform: projection.transform,
  fileFormat: 'GeoTIFF',
  formatOptions: {
    cloudOptimized: true
  }
});
The result of this is a .tif that has the correct resolution but in EPSG:4236 CRS.

