I am posting my issue in this community as I did not get satisfying answers in stackoverflow, hoping to get a solution here.
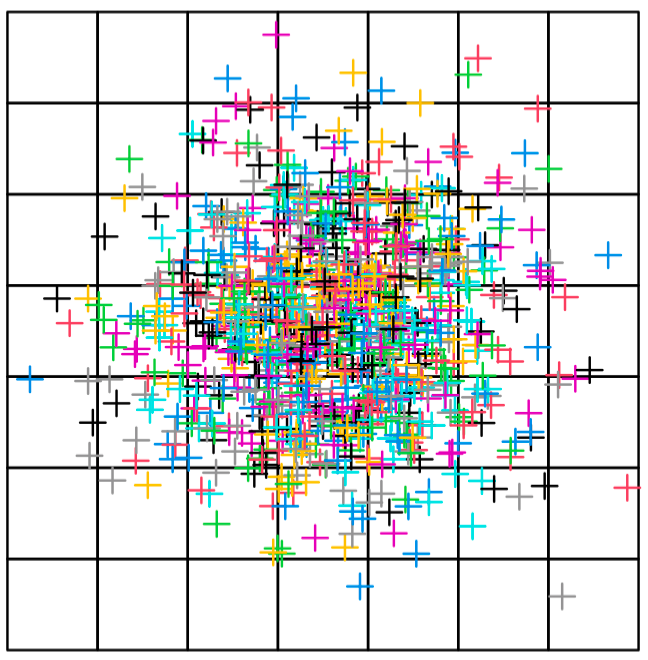
I am working on a spatial simulation and I created spatial points, but when I plot them with raster R package I can see that some points are outside the grid in the plot (example 1). Even when I try to define raster base on min and max values of XY coordinates(example 2).
I would like to know how I could be sure that all my points are inside the grid as I need to use polygon ID as localisation for the next steps of my simulations.
This is my code for reproducibility:
Example 1:
library(raster)
set.seed(100)
tmp = tmp2 = data.frame("x" = rnorm(1000, 10, 10),"y" = rnorm(1000, 10, 10))
coordinates(tmp) <- c("x", "y")
r1 <- raster(tmp, resolution = 10)
r1<-rasterToPolygons(r1)
plot(r1)
for (a in 1:nrow(tmp2)) {
  d = tmp2[a,]
  pts<- d
  coordinates(pts)<-~x+y
  plot(pts,add=T,col=a)
}
Example 2:
library(raster)
set.seed(100)
tmp = tmp2 = data.frame("x" = rnorm(1000, 10, 10),"y" = rnorm(1000, 10, 10))
coordinates(tmp) <- c("x", "y")

r1 <- raster(xmn = min(tmp2$x), xmx = max(tmp2$x),
          ymn = min(tmp2$y), ymx = max(tmp2$y),
          resolution = 10)

r1<-rasterToPolygons(r1)
plot(r1)
for (a in 1:nrow(tmp2)) {
  d = tmp2[a,]
  pts<- d
  coordinates(pts)<-~x+y
  plot(pts,add=T,col=a)
}

