2

I have 3 DEMs that I mask: non-NaN values = True and NaNs = False. I have an algorithm that plots the boundaries of the masks, but the issue is that it also plots the boundaries of the array of the mask (the parts that look like rectangles).polylines. How can I modify my code so it follows strictly boundary of my mask (blue area) ? mask

Code:

import os
import numpy as np
import geopandas as gpd
import rasterio.features
from shapely.geometry import shape, LineString
from rasterio.enums import Resampling

# Set the directory path containing the georeferenced tifs
list_dems = "/path_to_dems/*"

# Initialize an empty list to hold the polylines
lines = []

# Loop through each tif in the directory
for file in list_dems:
        # Open the tif file and read the data
        with rasterio.open(os.path.join(directory, file)) as src:
            data = src.read(1, masked=True)
            transform = src.transform
            crs = src.crs

        # Generate a binary mask of the valid data pixels
        mask = np.ma.masked_invalid(data).mask.astype(int)

        # Generate polygon geometries from the valid data mask
        shapes = rasterio.features.shapes(mask, transform=transform)

        # Convert polygon geometries to LineString geometries
        for polygon, value in shapes:
            if value == 1:
                boundary = shape(polygon).boundary
                if isinstance(boundary, LineString):
                        lines.append(boundary)

# Create a GeoDataFrame from the polylines
df = gpd.GeoDataFrame(geometry=lines, crs=crs)

# Save the GeoDataFrame as a shapefile
df.to_file("output.shp")

1 Answer 1

1

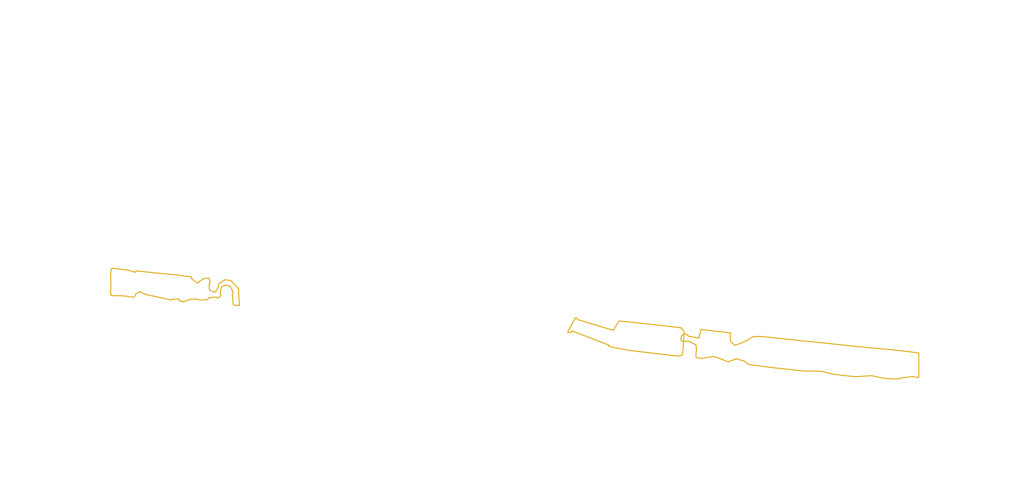
I find an answer but it is not optimal: I have to use xarray.open_rasterio which is deprecated. It allows me to access the CRS and Transform of my tif in a format that works with my code. Using xarray.open_dataset('file.tif').rio.crs or xarray.open_dataset('file.tif').rio.transform somehow does not work with my code anymore. enter image description here If someone has a suggestion about how to make the following code work with xarray.open_dataset('file.tif'), I will accept that one as the best answer.

Code:

import os
import numpy as np
import geopandas as gpd
import rasterio.features
from shapely.geometry import shape, LineString
from rasterio.enums import Resampling
import rioxarray

# Set the directory path containing the georeferenced tifs
directory = "/path/to/tifs/"

# Initialize an empty list to hold the polylines
lines = []

# Loop through each tif in the directory
for i in range(len(list_dems)):
        # Open the tif file and read the data
        dem = xr.open_rasterio(list_dems[i])
        data = dem.values[0]

        # Generate a binary mask of the valid data pixels
        mask = np.where(dem.values==-9999, 0, 1)[0]

        # Generate polygon geometries from the valid data mask
        shapes = rasterio.features.shapes(mask, transform=dem.transform)

        # Convert polygon geometries to LineString geometries
        for polygon, value in shapes:
            if value == 1:
                boundary = shape(polygon).boundary
                if isinstance(boundary, LineString):
                        lines.append(boundary)

# Create a GeoDataFrame from the polylines
df = gpd.GeoDataFrame(geometry=lines, crs=dem.crs)

# Save the GeoDataFrame as a shapefile
df.to_file("output.shp")
Your Answer

By clicking “Post Your Answer”, you agree to our terms of service and acknowledge you have read our privacy policy.

Not the answer you're looking for? Browse other questions tagged or ask your own question.