0

I have that geoid heights (quasi-geoid model hBG18) in a form that matrix :

library(tidyverse)
Geo <- read.table("https://www.isgeoid.polimi.it/Geoid/Europe/Belgium/public/hBG18.dat", 
           header=FALSE)
Geo <- Geo %>% rename("x" = "V2", "y" = "V1","z" = "V3")

And I would like to extract that heights for the given locations:

newdata <- structure(list(x = c(5.6029075, 5.60290583333333, 5.60290283333333, 
5.60289525, 5.60289583333333, 5.60289016666667), y = c(49.7203561666667, 
49.7203568333333, 49.7203568333333, 49.7203585, 49.7203595, 49.7203593333333
)), row.names = c(NA, 6L), class = "data.frame")

I have tried to use interp.surface() from the package 'fields' but it does not work.

newdata$z <- fields::interp.surface(Geoide, newdata)
Error in xy.coords(x, y, setLab = FALSE) : 'x' and 'y' lengths differ

I was wondering how could I proceed to obtain that Z value.

I have also tried to do an interpolation of the Geoid heights with interp() form the package "akima", to after extract the Z value. But the code does not work either...

EDIT

More information about the quasi-geoid model used

1
  • What's Geoide? Have you tried to convert the dataframe from the file to a list as described in the documentation for interp.surface? If that's gone wrong then that could be the reason for the error. Edit the Q to show how you made Geoide.
    – Spacedman
    Commented Jun 10, 2023 at 13:37

2 Answers 2

1

Read the data - I had to download the data separately because the site has an invalid certificate. Also there's no need to pull in the tidyverse to rename some columns:

> Geo <- read.table("hBG18.dat", header=FALSE)
> names(Geo)=c("y","x","z")

Now convert to a list structure. I'm not sure if this is the right way round, I should take more care with my X and Y coordinates, but its irrelevant at this point. If this data doesn't look like you expect then transpose it or something.

> d = list(x=unique(Geo$x), y=unique(Geo$y), z=matrix(Geo$z, 401,401))
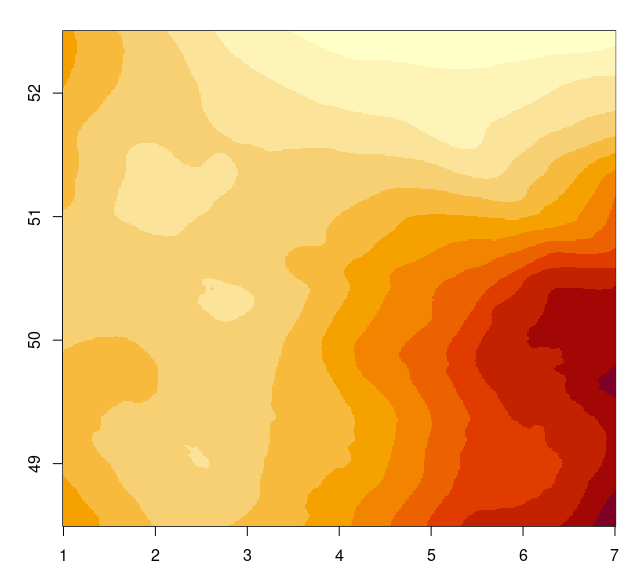
> image(d)

enter image description here

x-y of newdata overlays x-y of d:

> newdata
         x        y
1 5.602907 49.72036
2 5.602906 49.72036
3 5.602903 49.72036
4 5.602895 49.72036
5 5.602896 49.72036
6 5.602890 49.72036

And we can interpolate:

> interp.surface(d, newdata)
[1] 45.19709 45.19709 45.19709 45.19708 45.19708 45.19708

This is a bit slapdash but I'm busy, but basically you need to reshape your data frame into a 401 x 401 matrix in the right order with a vector of X and Y coordinates, both of length 401.

1
  • Thank you, it works perfectly.
    – C. Guff
    Commented Jun 11, 2023 at 23:33
1

You can use terra::extract with "method=bilinear"

Your example data

Geo <- read.table("https://www.isgeoid.polimi.it/Geoid/Europe/Belgium/public/hBG18.dat", header=FALSE)
colnames(Geo) <- c("y", "x", "z")
pts <- data.frame(x = c(5.6029075, 5.60290583333333, 5.60290283333333, 
5.60289525, 5.60289583333333, 5.60289016666667), y = c(49.7203561666667, 
49.7203568333333, 49.7203568333333, 49.7203585, 49.7203595, 49.7203593333333
))

Solution

library(terra)
x <- rast(Geo[, c(2,1,3)], type="xyz")
e <- extract(x, pts, method="bilinear")
e
#  ID      z
#1  1 45.19709
#2  2 45.19709
#3  3 45.19709
#4  4 45.19708
#5  5 45.19708
#6  6 45.19708

Your Answer

By clicking “Post Your Answer”, you agree to our terms of service and acknowledge you have read our privacy policy.

Not the answer you're looking for? Browse other questions tagged or ask your own question.