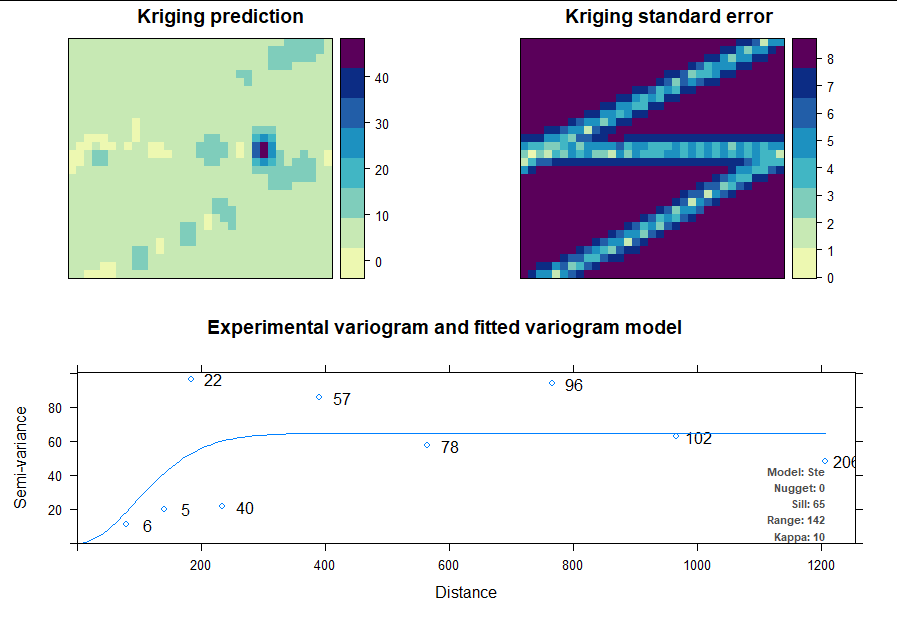
I have estimates of fish density along transects from a lake and would like to extrapolate these estimates for the entire lake surface, using kriging methods. Based on information from here, here and here I have put together some code, but am somewhat underwhelmed by the result.
Data (reduced example)
 points <- new("SpatialPointsDataFrame", data = structure(list(fish_ha = c("0",
                                                                   "0", "312", "227", "0", "455", "603", "112", "247", "265", "249",
                                                                   "770", "357", "236", "69", "220", "137", "284", "762", "1675",
                                                                   "522", "458", "345", "352", "245", "155", "156", "273", "349",
                                                                   "159", "0", "0", "0", "24", "122", "329", "220", "233", "393",
                                                                   "280", "360", "258", "389", "218", "897", "621", "96", "0"),
                                                       kg_ha = c("0", "0", "4", "13", "0", "8", "11", "1", "16",
                                                                 "3", "6", "10", "11", "12", "0", "0", "8", "8", "9", "49",
                                                                 "4", "9", "13", "10", "4", "0", "3", "2", "4", "11", "0",
                                                                 "0", "0", "0", "0", "5", "1", "7", "5", "4", "5", "3", "10",
                                                                 "8", "12", "12", "16", "0")), row.names = c(NA, 48L), class = "data.frame"),
       coords.nrs = numeric(0), coords = structure(c(4433881.1568807,
                                                     4434063.60990585, 4434248.52978213, 4434424.85550047, 4434609.13424212,
                                                     4434789.09718599, 4434961.90436403, 4435144.06069923, 4435319.2348634,
                                                     4435491.86377727, 4435664.21278297, 4435844.41156398, 4436020.02906396,
                                                     4436199.23270384, 4436369.11069566, 4436425.38302424, 4436251.93393992,
                                                     4436074.63414255, 4435895.64721142, 4435713.93015789, 4435534.31261496,
                                                     4435355.02277154, 4435169.23010039, 4435008.18551482, 4434822.16338571,
                                                     4434612.63799854, 4434497.14610166, 4434310.76818349, 4434130.32709306,
                                                     4433952.87071154, 4433770.4969528, 4433676.2458604, 4433761.22108147,
                                                     4433828.82289591, 4434003.57719308, 4434193.63055075, 4434375.25860433,
                                                     4434564.25516186, 4434749.01519503, 4434931.19940932, 4435117.92409774,
                                                     4435298.99069721, 4435496.73990189, 4435669.74828463, 4435865.15000385,
                                                     4436040.60330774, 4436224.66669998, 4436403.18795118, 5312861.836658,
                                                     5312933.63486221, 5313011.00222572, 5313100.98546289, 5313184.76380388,
                                                     5313276.55707233, 5313376.06518777, 5313463.36494439, 5313561.31118271,
                                                     5313664.51767385, 5313766.74450944, 5313855.76146538, 5313952.32434893,
                                                     5314046.71579149, 5314128.40161701, 5314201.72910295, 5314225.99569893,
                                                     5314222.97125282, 5314227.9850289, 5314223.04148194, 5314222.10196228,
                                                     5314224.20389437, 5314229.84305795, 5314218.85634075, 5314214.47324543,
                                                     5314196.85755598, 5314203.17314432, 5314223.90908531, 5314212.71235654,
                                                     5314194.7295721, 5314176.3936568, 5314079.49237766, 5314185.62832972,
                                                     5314208.02911493, 5314292.57740121, 5314373.63466771, 5314456.73837339,
                                                     5314542.36976885, 5314632.61275978, 5314724.6514073, 5314807.60929174,
                                                     5314901.69214647, 5314997.06141053, 5315067.37271931, 5315161.91513888,
                                                     5315241.88662221, 5315333.11425499, 5315433.52566703), .Dim = c(48L,
                                                                                                                     2L), .Dimnames = list(NULL, c("coords.x1", "coords.x2"))),
       bbox = structure(c(4433676.2458604, 5312861.836658, 4436425.38302424,
                          5315433.52566703), .Dim = c(2L, 2L), .Dimnames = list(c("coords.x1",
                                                                                  "coords.x2"), c("min", "max"))), proj4string = new("CRS",
                                                                                                                                     projargs = "+proj=tmerc +lat_0=0 +lon_0=12 +k=1 +x_0=4500000 +y_0=0 +ellps=bessel +units=m +no_defs"))
Code
slot(points, "proj4string") <- CRS(SRS_string = "EPSG:31468")

grid <- as.data.frame(spsample(points, "regular", n = 1000)) %>%
  rename(x = x1, y = x2)
coordinates(grid) <- c("x", "y")
gridded(grid) <- TRUE
fullgrid(grid) <- TRUE
slot(grid, "proj4string") <- CRS(SRS_string = "EPSG:31468")

kriging_result <- autoKrige(kg_ha ~ 1, points, grid)
plot(kriging_result)
Question
It looks to me like there hasn't been a lot of extrapolation outside of the actual transects. Is there any way to get predictions for a larger area?
N.B.: I have not clipped the grid to match the outline of the lake. I've had some issues there too, but for simplicity let's just look at the kriging for the time being.

