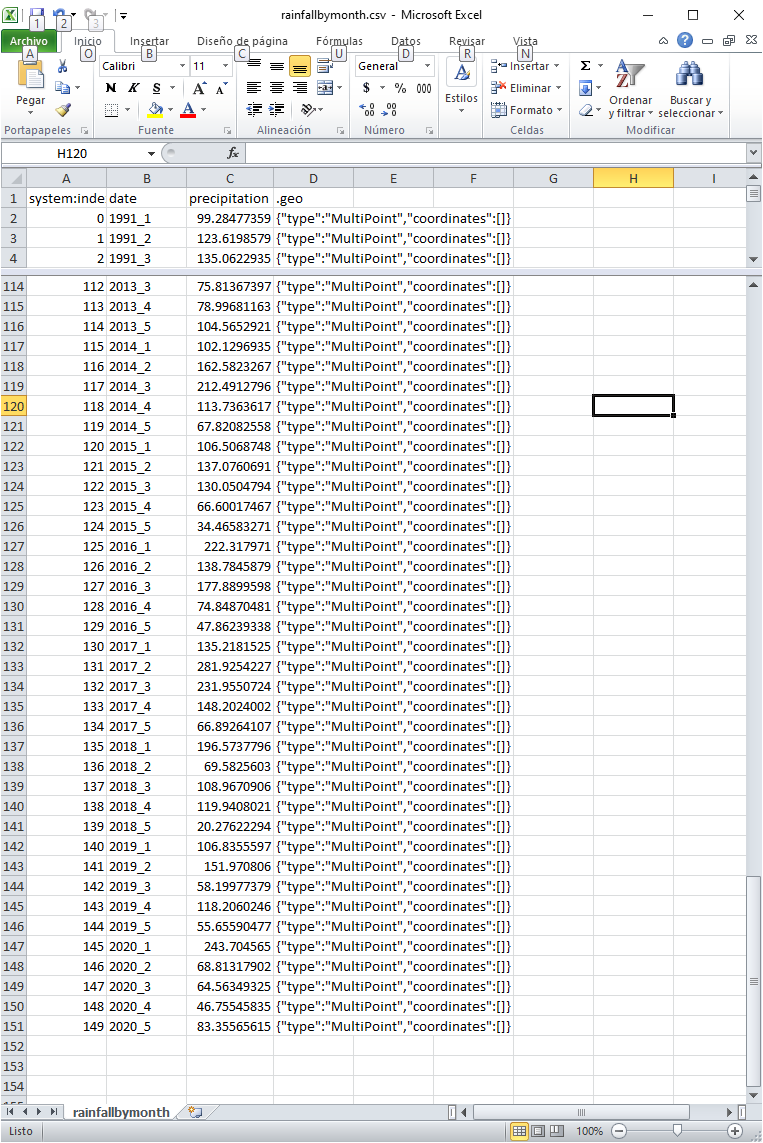
I am working with rainfall monthly totals for a 30-year period using CHIRPS pentad.
//1.Reference Period
var historical = ee.List.sequence(1991, 2020)
var months = ee.List.sequence(1, 5)
//print(historical)

//2.Map over the years and create a monthly totals collection
var monthlyImages = historical.map(function(year){
  return months.map(function(month){
    var filtered = chirps
    .filter(ee.Filter.calendarRange(year, year, 'year'))
    .filter(ee.Filter.calendarRange(month, month, 'month'))
    var monthly = filtered.sum();
    return monthly.set({'month': month, 'year': year})
  })
}).flatten()

print(monthlyImages)

//3. Create an Image Collection for each month of each year
var monthlyCol = ee.ImageCollection.fromImages(monthlyImages)
print(monthlyCol)

//4. Convert to Feature Collection
var montlyRainfall = ee.FeatureCollection(monthlyImages)

// Export.table.toDrive({
//   collection: monthlyRainfall,
//   fileNamePrefix: 'rainfallbymonth',
//   fileFormat: 'CSV'})
I have been able to get an Image Collection with 150 images for the months I require. I am looking to export each monthly totals(sum) to a table and obtain results from my geometry.
Transforming my Image Collection to a Feature Collection and exporting to CSV has worked with the correct dates but it just doesn't contain the values from my 'precipitation' band which is the sum that I filtered in the first code of block.
I understand I need to transform my image collection to a feature collection and tell it to assign the dictionary values to my table I just have not figured out how to do it. I am also not sure if I need to Reduce.sum again even though I have filtered my monthly images totals using .sum already.

