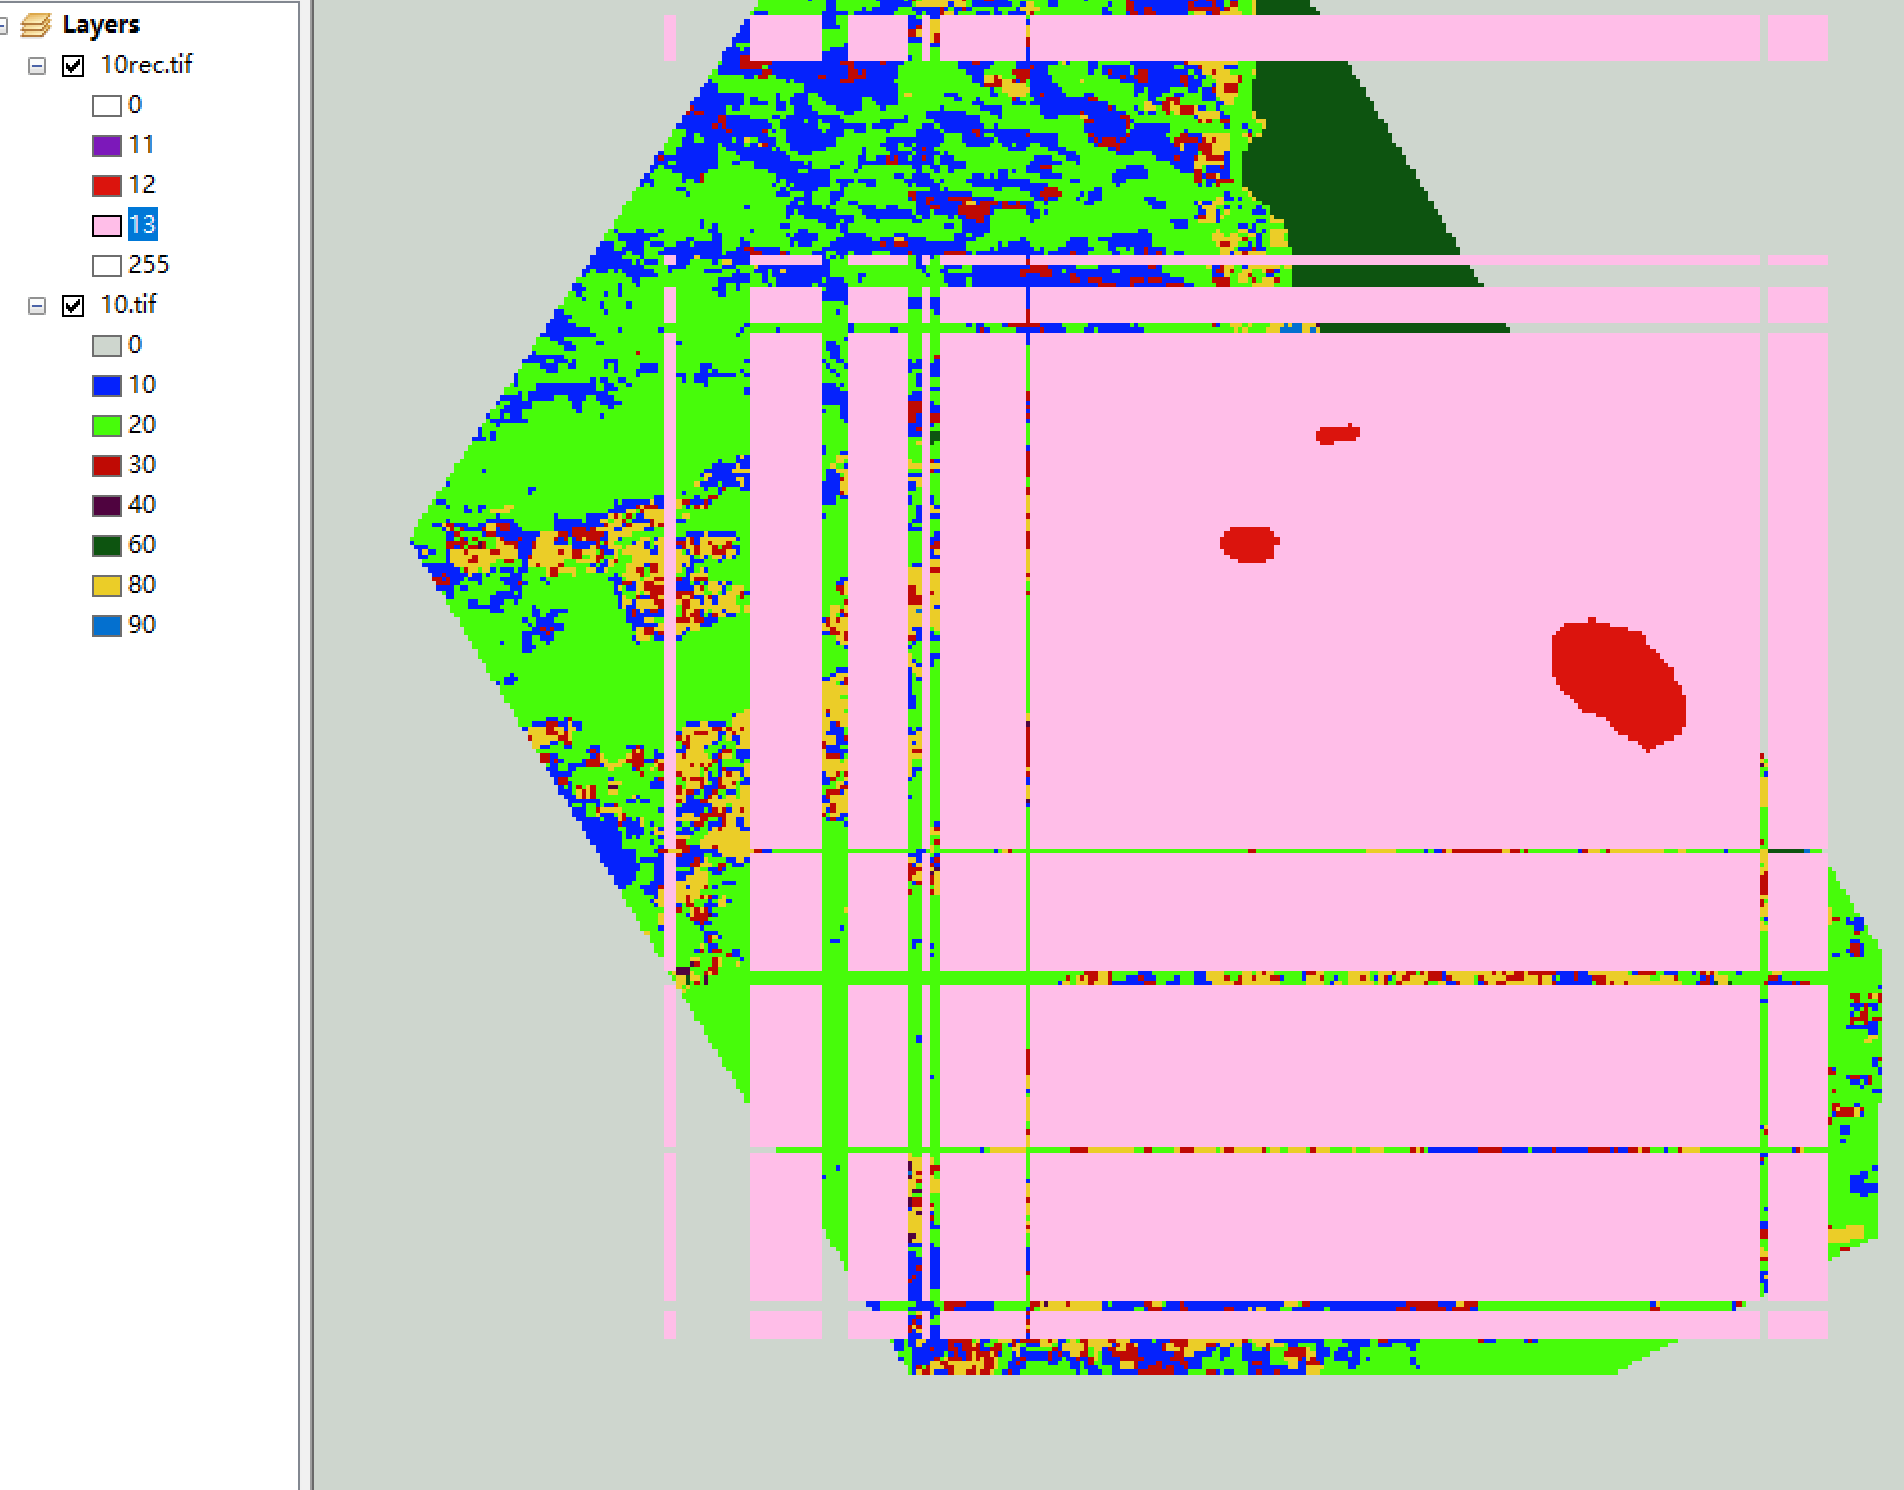
I am trying to run focal statistics in Python. The idea is to set a 1 square kilometers buffer (circular) around each pixel, then the percentage of certain type of pixels inside the buffer was calculated. The central pixel will be assigned a label based on the percentage. I am able to generate a Python code to complete the process. However, there are two issues. First, the result does not make sense. I cannot get a circular shape but a square one. Second, the process takes a long time. I tried to add parallel processing but it still took 5 hours to process one image. The same task can be completed in ArcGIS in 7 minutes. My code is shown as following.
import os
import rasterio
import numpy as np
import geopandas as gpd
from concurrent.futures import ProcessPoolExecutor

shapefile_path = "directory to an outside boundary shapefile"
gdf = gpd.read_file(shapefile_path)
urban = gpd.read_file("a shapefile for defining an inside boundary")

# Convert the CRS of 'urban' GeoDataFrame to match the CRS of 'gdf'
urban = urban.to_crs(gdf.crs)

def reclass(raster_path):
    with rasterio.open(raster_path) as dataset1:
        raster_data = dataset1.read()[0]

    [x_list,y_list] = np.where(raster_data==1)

    urban_reclass = raster_data
    if np.shape(x_list)[0] >int(33*33/2):
        for x in x_list:
            for y in y_list:
                tmp = []

                x_line = np.nanmin([x,np.shape(raster_data)[0]-x,20])
                y_line = np.nanmin([y,np.shape(raster_data)[1]-y,20])
                for i in range(x_line):
                    for j in range(y_line):
                        tmp.append(raster_data[x-i][y-j])
                        tmp.append(raster_data[x+i][y+j])
                        tmp.append(raster_data[x-i][y-j])
                        tmp.append(raster_data[x+i][y+j])


                tmp = np.array(tmp)
                if np.shape(tmp[tmp==1])[0] >= np.shape(tmp)[0]/2:
                    urban_reclass[x][y] = 11
                if np.shape(tmp[tmp==1])[0] < np.shape(tmp)[0]/2 and np.shape(tmp[tmp==1])[0] >= np.shape(tmp)[0]/4:
                    urban_reclass[x][y] = 12
                if np.shape(tmp[tmp==1])[0] < np.shape(tmp)[0]/4:
                    urban_reclass[x][y] = 13
        if os.path.exists(r"output directory\relcass2\\") == False:
            os.makedirs(r"output directory\relcass2\\")
        file_name = raster_path.split("\\")[-1][:-4]
        with rasterio.open(r"outputdirectory\relcass2\\" + file_name + ".tif", mode='w', driver='GTiff',
                              width=dataset1.width, height=dataset1.height, count=1,
                              crs=dataset1.crs, transform=dataset1.transform, dtype=np.uint8) as dst:
            dst.write(urban_reclass, 1)

# Define the directory containing the raster files
input_dir =  "Folder containing raster files"

# Get a list of raster file paths
raster_files = [os.path.join(input_dir, file) for file in os.listdir(input_dir) if file.endswith(".tif")]

# Process the raster files in parallel using all available CPU cores
with ProcessPoolExecutor() as executor:
    results = executor.map(reclass, raster_files)

# Print the percentage of different pixel types for each raster file
for result in results:
    raster_path, urban_reclass = result
    print(f"Raster file: {raster_path}")
    unique, counts = np.unique(urban_reclass, return_counts=True)
    total_pixels = np.sum(counts)
    for value, count in zip(unique, counts):
        percentage = (count / total_pixels) * 100
        print(f"Pixel type {value}: {percentage:.2f}%")
    print()
The front layer is the result. I assigned the labels of class 11(>=50%), 12(<50% but >=25%), 13(<25%). The raster layer used to generate the above one is also displayed. Value 80 represent impervious surface, which I used for calculation and reclassification.

