0

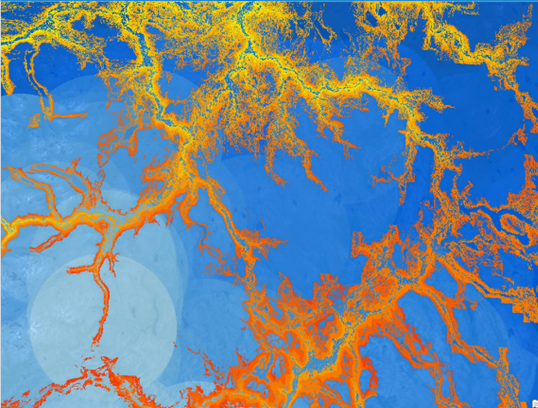
Based on the instructions on how focal stastics work: https://pro.arcgis.com/en/pro-app/latest/tool-reference/spatial-analyst/how-focal-statistics-works.htm, I had expeced a more continuous result than what the output provides:

Instead of the neighbourhood determining the value of the focal cell it seems like the focal cell determines the values of the neighbourhood. Or it perhaps a result of the latest calculation overwrites the calculations of nearby cells?

The yellow-red scale is the input raster, and blue-white is the result of focal statistics. The input raster is integers, and it should find the maximum in a circular neighbourhood with 2000 cells radius, with Ignore NoData set to true. I can understand observing circular patterns near the borders, but not in the middle of raster.

The yellow-red scale is the input raster, and blue-white is the result of focal statistics.


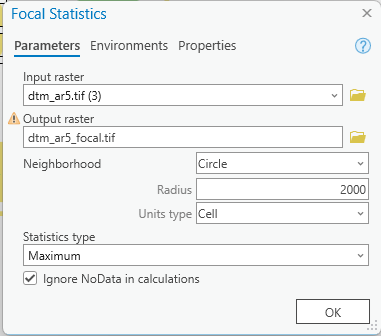
EDIT: added screen shots per commenters request. First image is of the settings used, the second is a screen shot showing the layers and their legend as shown in the contents pane.

enter image description here enter image description here

3
  • Can you share your tool input and the legends for both layers? I'm wondering if you've got a mismatch between either what you meant to run and what you did run, or if the output symbology is causing confusion. Commented Jul 15 at 13:14
  • @ycartwhelen, I edited the post per your request. Any ideas?
    – ego_
    Commented Jul 15 at 18:20
  • Buffer single point and clip original to prove your suspicion
    – FelixIP
    Commented Jul 15 at 23:33

1 Answer 1

0

That looks as expected to me.

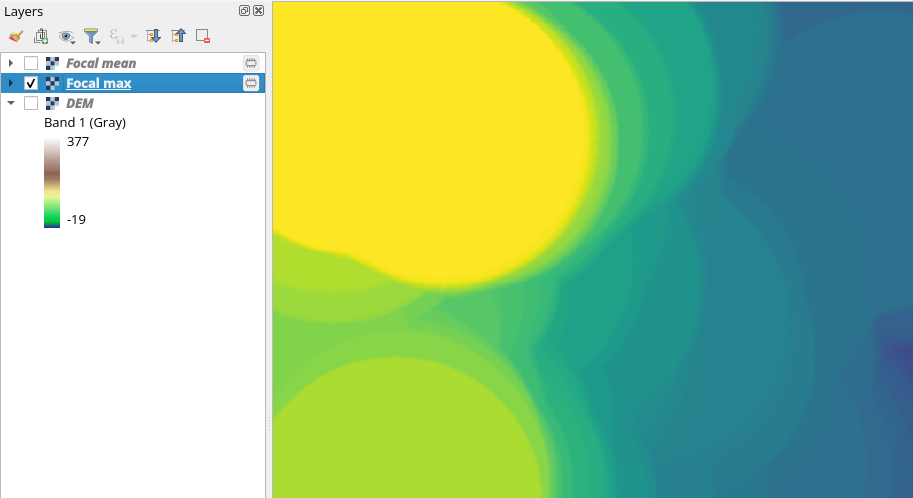
The algorithm finds the maximum value in a circle neighbourhood around each cell. For any given cell in a circular looking pattern in the output (e.g. in the lower left of your example, note that I'm not talking about the circle neighbourhood used in the focal algorithm, but the visual circular patterns in the output), even for cells towards the outer edge of that visual circle pattern, the maximum value is always going to be the value in the centre of the pattern.

Consider the overall maximum value of the whole raster. All cells within a circle around that value will get assigned that value because a circular focal neighbourhood centered over any of those cells will include that maximum value. Once your circular focal neighbourhood gets more than 2000 cells (circle radius) away from that particular maximum value then the maximum value changes.

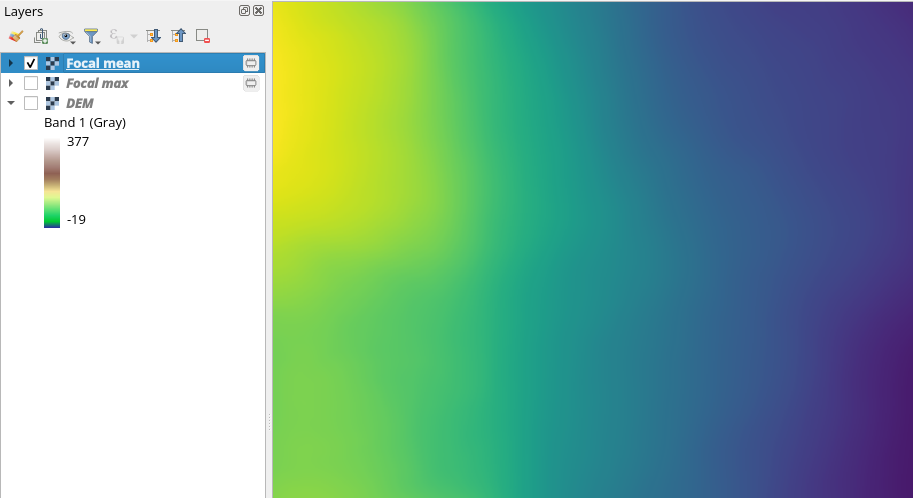
If you want to see a more continuous output, use a continuous statistic like mean.

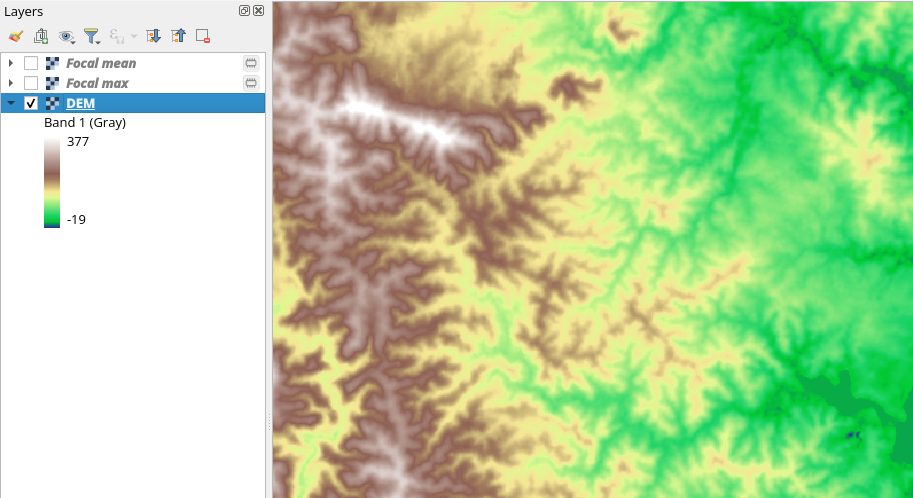
This is using QGIS and GRASS r.neighbors, but the algorithm is the same:

Input raster

enter image description here

Focal max, note circles in output

enter image description here

Focal mean, much smoother

enter image description here

2
  • You understand correctly in terms of circular pattern. But it seems than that my expectations were wrong then. Imagine a flat landscape with a north-south going mountain range. And by using 'Max' you would get something that looked like a buffered version of the mountain range expanding outwards onto the flat landscape. Well, well. Thanks!
    – ego_
    Commented Jul 16 at 10:18
  • Yes, different expectations. Note the circular pattern is greatly exaggerated because you've used a massive neighbourhood, i.e. 2000 cells. So the radius as an actual distance is 2000 x cellsize.
    – user2856
    Commented Jul 16 at 10:27

Your Answer

By clicking “Post Your Answer”, you agree to our terms of service and acknowledge you have read our privacy policy.

Not the answer you're looking for? Browse other questions tagged or ask your own question.