0

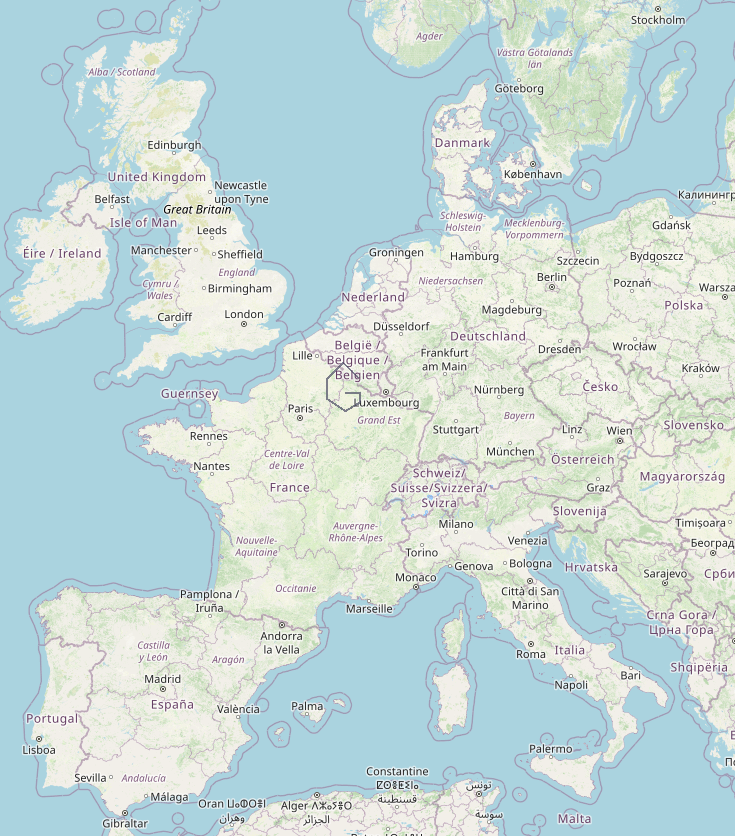
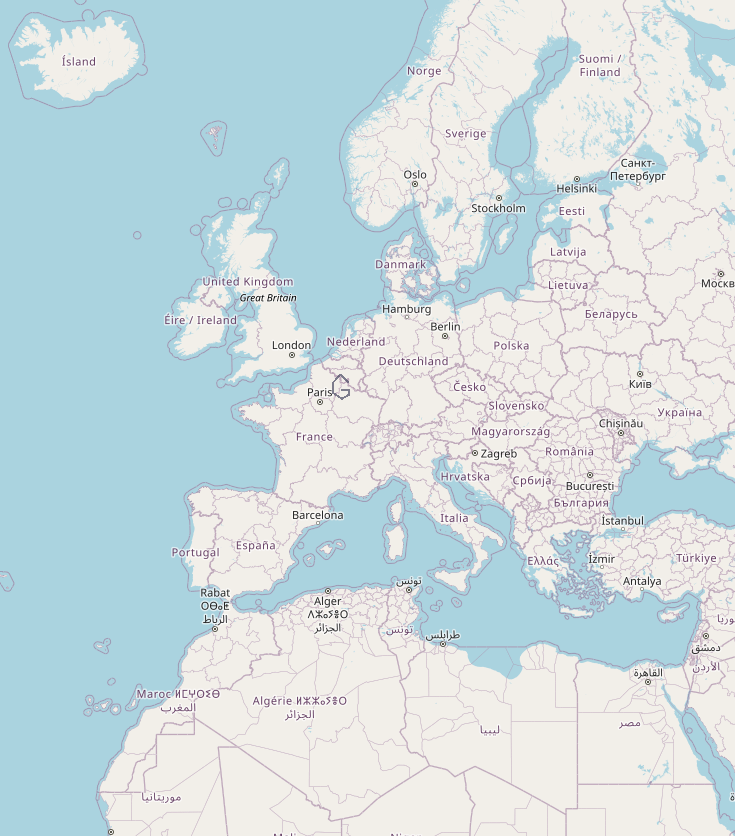
This webmap shows raster tiles overlaid on OSM rastertiles. One such tile, for example the 10/508/336 tile looks like this:
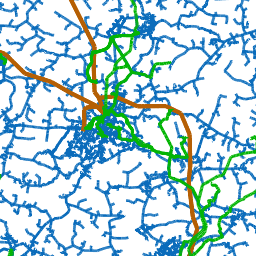
I would like to create a directory of such tiles using command line tools. Here is an example of GeoJSON:

{
"type": "FeatureCollection",
"name": "source",
"crs": { "type": "name", "properties": { "name": "urn:ogc:def:crs:OGC:1.3:CRS84" } },
"features": [
{ "type": "Feature", "properties": { }, "geometry": { "type": "LineString", "coordinates": [ [ 4.90571755, 50.00687119 ], [ 4.26413271, 50.41744784 ], [ 3.53584721, 49.9399581 ], [ 3.54162726, 49.39377674 ], [ 4.36817349, 49.03887689 ], [ 4.9924182, 49.27701689 ], [ 5.00397829, 49.55902504 ], [ 4.36817349, 49.55527559 ] ] } }
]
}

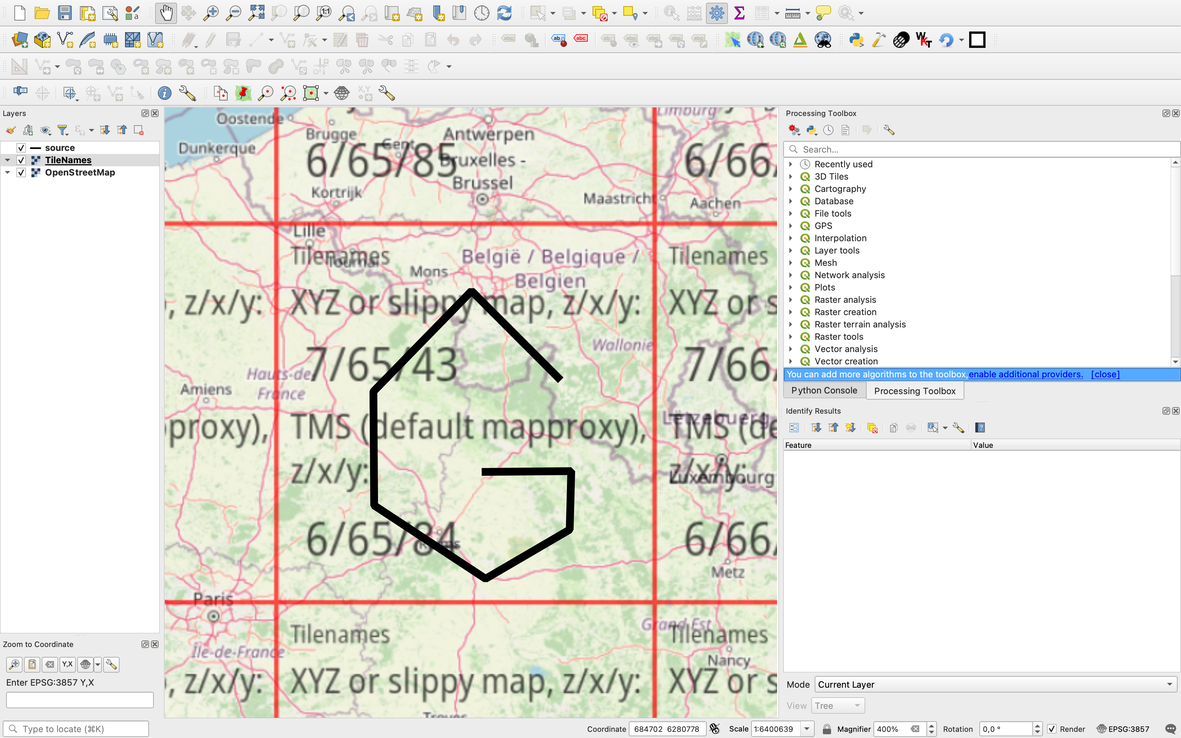
It covers the 7/65/43 tile:

enter image description here

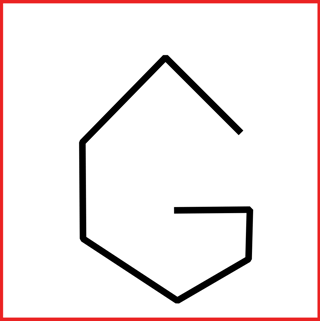
In the directory structure I would like to create, 7/65/43.png would look something like this (I left the red boundary, so it is easier to see where the boundary of the image is):

enter image description here

I know about tippecanoe, and vector tiles in general. Here, I am asking about raster tiles. In Directly generating XYZ tiles from GeoJSON, tippecanoe is suggested. In Converting GeoJSON file to XYZ tiles, QGIS is suggested. I would like to use command line tools. GDAL can do many things, I hope it can do this as well (but I'm open to other tools as well). I have read about gdal2xyz, but the input is a raster file, not a vector file.

How to create a directory tree of raster tiles from a GeoJSON using command line tools?

2
  • gdal2xyx isn't for xyz tiles, it outputs XYZ delimited text files. How big is your area? You could gdal_rasterize at highest resolution then gdal2tiles
    – user2856
    Commented Aug 25 at 23:27
  • Thank you for the clarification. My area is Norway, so quite big. Once I have a tileset of powerlines not in OpenStreetMap, I would like to create a tileset so I can map them. "NVE Electricity Network overlay" already exists (in iD), but I'd like to create an overlay which only covers the unmapped gridlines.
    – zabop
    Commented Aug 26 at 5:59

1 Answer 1

2

One way to do this would be to create the tiles by rasterizing the GeoJSON with an appropriate pixel size/resolution for each zoom level.

If you are open to using some Python, you could automate this using the GDAL Python API to calculate the appropriate resolution, rasterize the GeoJSON and then call gdal2tiles at each zoom level.

The below example writes out tiles for your example GeoJSON (buffering the lines slightly so they stand out a bit more):

from osgeo_utils.gdal2tiles import GlobalMercator, main as gdal2tiles
from osgeo import gdal

geojson = "input.geojson"
outdir = "output"
rgb = (75, 75, 100)  # colour to output
zoom_levels = range(1, 13)

# in memory temp files
reprods = "/vsimem/epsg3857.geojson"
buffds = "/vsimem/epsg3857buff.tif"

gdal.VectorTranslate(reprods, geojson, dstSRS="epsg:3857", reproject=True)

gm = GlobalMercator()
for zoom in zoom_levels:
    resolution = gm.Resolution(zoom)
    gdal.Rasterize(
        buffds,
        reprods,
        noData=0,
        xRes=resolution,
        yRes=resolution,
        burnValues=rgb,
        # optional - buffer lines a bit so they stand out
        SQLDialect="SQLite", SQLStatement=f"SELECT ST_Buffer(geometry, {resolution}) FROM source",
        outputType=gdal.GDT_Byte,
        creationOptions={"compress":"deflate"}
    )
    gdal2tiles(["this arg is required but ignored", buffds, outdir, "-z", f"{zoom}"])

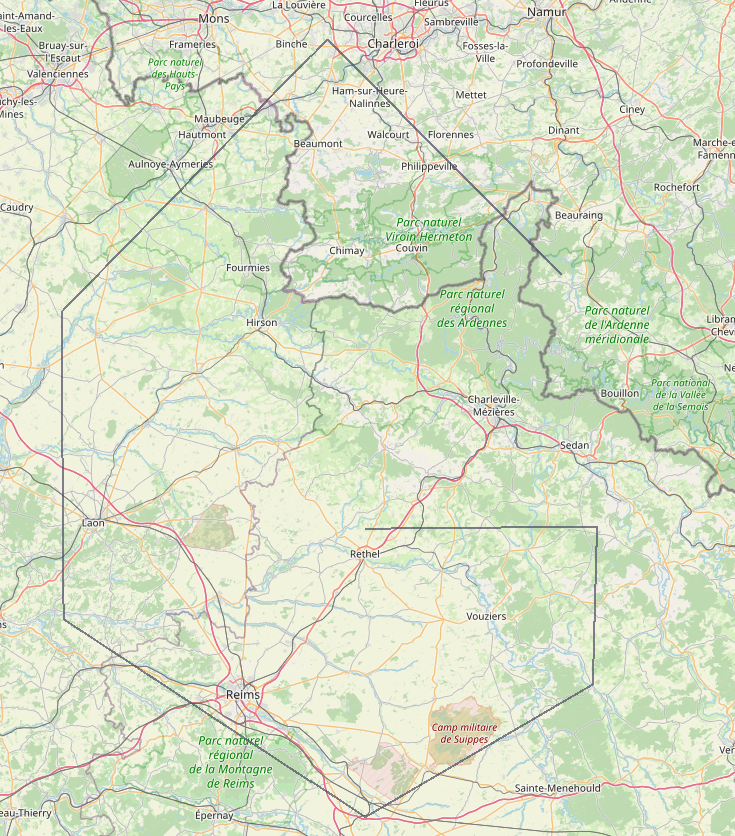
enter image description here

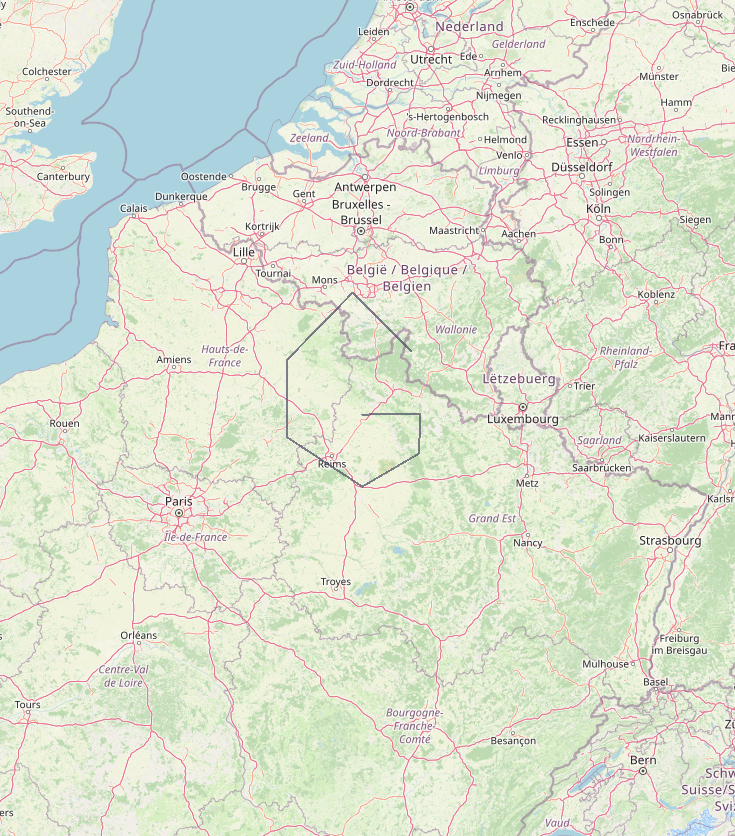
enter image description here

enter image description here

enter image description here

Your Answer

By clicking “Post Your Answer”, you agree to our terms of service and acknowledge you have read our privacy policy.

Not the answer you're looking for? Browse other questions tagged or ask your own question.