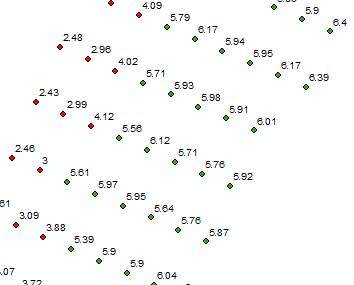
I have hydrographic data in the form of an xyz file. I would like to display it in ArcMap. I need to symbolize the points based on their depth, shallow points one colour and deep points another. With a small subset of data I was able to import the symbols, symbolize based on elevation and turn on labels at an appropriate scale.

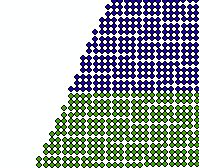
I then tried creating a multi-point file with the full dataset and set the symbology the same however I end up with unnatural bands.

Is there a way to get the multi-point file to display the same symbology as the sample set? I want the user to be able to quickly zoom in and out of the data to be able to check the depth of any given point.
