11

I am very new to GIS. I found a tutorial on how to make a choropleth using Python tools. I want to follow it but use my own data and map. However the tutorial uses a US map SVG file and I need to use a CA zipcode map. The only map that I have found in a shapefile from the US Census. I have tried using kartograph.py to convert it to SVG, but it loses the zipcode within the file when I do so. How can I convert the file to SVG and keep each path id'ed as the appropriate zipcode.

I am trying to follow the How to Make a US County Thematic Map Using Free Tools tutorial. That should give you an idea of what I am trying to do, only I don't have a SVG formatted map.

I have seen references to javascript utilities. I have never used Javascript but suppose I could use something simple.

4 Answers 4

6

check out the kartograph library: http://kartograph.org/. This might do the job for you. There are good examples and tutorials on the site.

There is also the QGIS simplesvg plugin that if I remember correctly keeps SHP attributes as ID in the SVG: http://www.duif.net/qgis/simplesvg/

2
  • I already tried kartograph.py and it didn't seem to keep the id. That's for the tip on QGIS. I'll be working on it more tonight.
    – chrisfs
    Commented Jul 15, 2013 at 16:46
  • I remember that it had worked for me with kartograph. I can look at my old projects later. Have you tried this example from the kartograph website: kartograph.org/docs/kartograph.py/… Which software do you use to read the SVG-file?
    – Chris P
    Commented Jul 16, 2013 at 6:22
1

I have managed to get the end result, but with slightly more effort than is ideal.

  1. Convert the Shapefile to an SVG using https://mapshaper.org/.
  2. Use QGIS to export the shapefile to CSV (https://gis.stackexchange.com/a/135806).
  3. Open the CSV and copy the column you want to keep. Using a text editor, add the data to each path in the SVG file. I used Sublime Text, but any editor will do. What does help is being able to paste them all at the same time rather than doing them one by one, especially if you have many paths.

I've done this only once so far and the order seems to be correct. I don't know if this will always be the case though, so I'd do a quick check to see if the data matches the area.

0

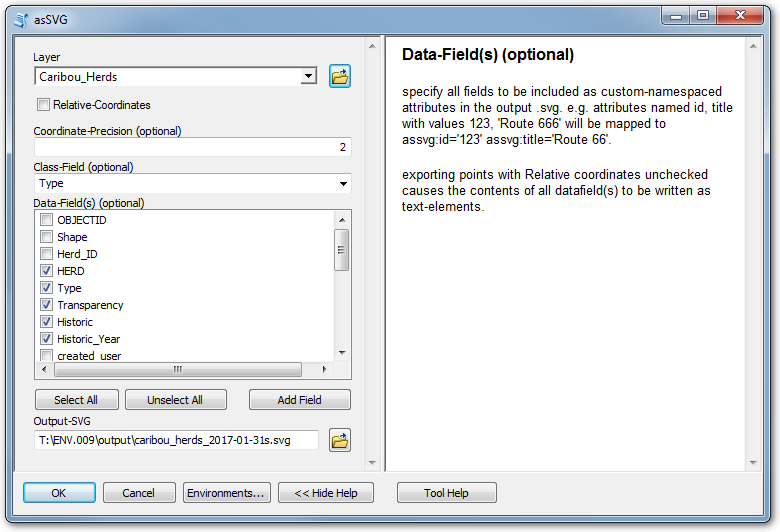
See AsSVG, which is part of the standard distributions of PostGIS (2005), GRASS (2008, v6.3) and Spatialite (v2.3.1).

An updated version of the ArcGIS script and toolbox is on Github openwebcc/assvg.

In my experience the output svg files show fine in a browser but in Inkscape and Illustrator are scaled so large they are off the page. A workaround is to import, select all, then scale to fit page height and width (being careful to insure "lock aspect ratio" is checked).

ArcGIS Toolbox

0

If anyone's interested, I wrote a tool and a tutorial that makes it easy to transform GeoJSON files derived from shapefiles using QGIS. It's based on the @gagan-bansal's geojson2svg library by of the same name.

All the instructions and required knowledge are outlined on the Readme following the link on GitHub. It also includes resources to get you started with QGIS.

Once you get the hang of it, it's a matter of a couple of clicks to transform a shapefile to an SVG.

Features:

  • Transcribe attributes like country names and ISOs from GeoJSON to SVG and even rename them
  • Transform geometric data to center the SVGs (with example)
  • Compress SVGs using a built-in tool

If you need help or clarifications, open an issue and I'll be glad to help.

Your Answer

By clicking “Post Your Answer”, you agree to our terms of service and acknowledge you have read our privacy policy.

Not the answer you're looking for? Browse other questions tagged or ask your own question.