3

Background I'm starting with a map from the internet (Encyclopaedia Britannica) and georeferencing it using QGIS 2.0.1, I get really accurate georeference solution using polynomial 2 transformation: very small residuals, most less than 5 pixels. (This is surprising because the previous time I tried this, I got pretty poor results: Improving Georeferencing results? though now I am using more points (31) and was quite careful with them.)

The georeference window:
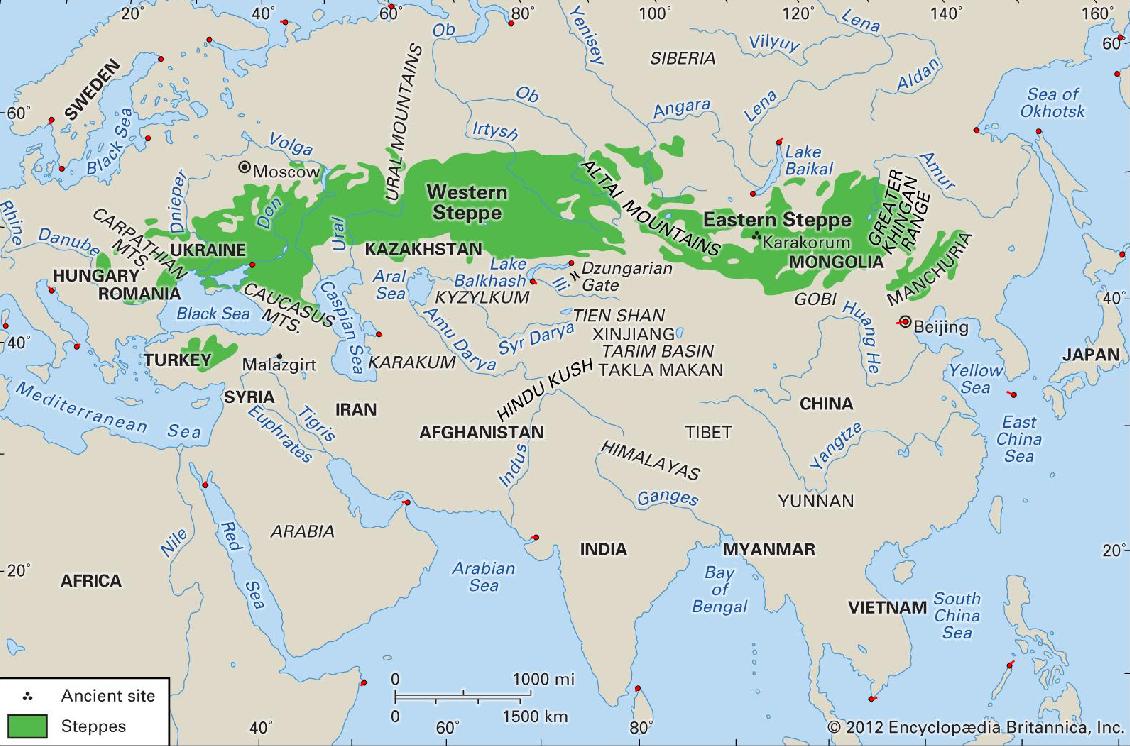
The fit

(note the very slight residuals, the biggest of which is the small line emanating from Beijing). This produces the following overlay, which you can tell is quite good.
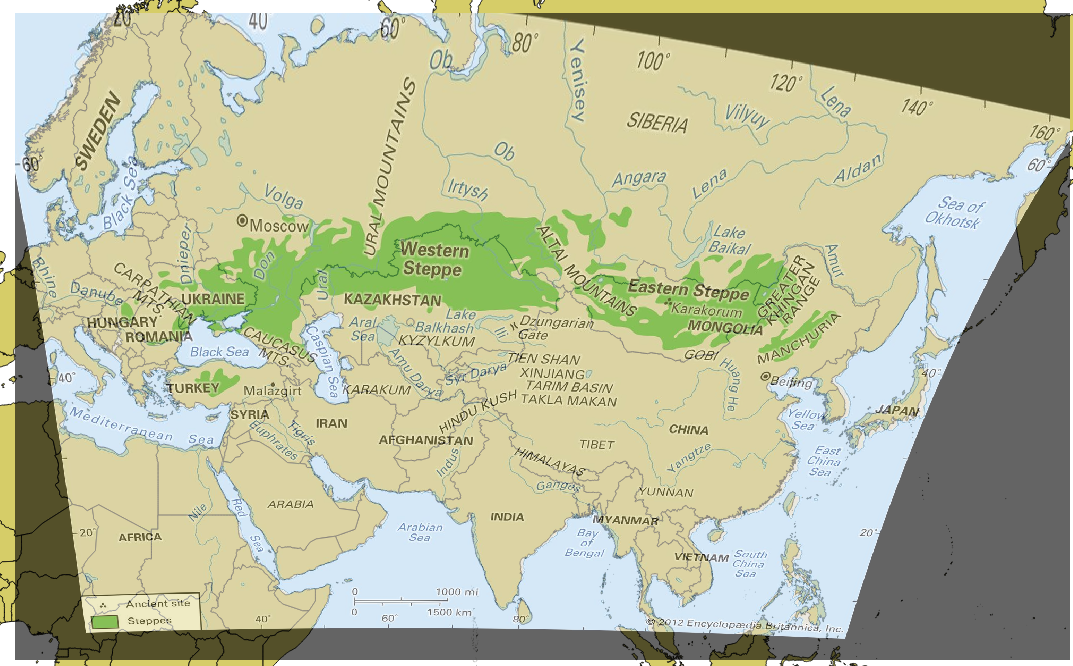
Georeferenced map

Goal I'd like to identify the projection and its parameters used by the cartographer.

Questions Can the fact that a polynomial 2 fits really well be used to narrow down the list of projections that the map uses? Or do many/most projections georeference well with polynomial 2 when applied over such a large geographic extent and with so many control points?

(I can disable most of the control points and as long as I include at least one in the northern regions, I can get the same very good georeference. And of course polynomial 3 works very well also.)

(I've also tried to fit most of the pseudocylindrical projections mentioned in The Proj Manual (1996, revised 2003) to see if one can be made to match the control points as well as the polynomial 2 georeference fit, but the latter is much better than any of those fitted projections.)

The GCPs I have put the GCPs at http://pastebin.com/pWti0W8k. The map x/y are in EPSG:4326 (I used the Google Physical OpenLayers map as the reference but then reprojected those EPSG:3857 to EPSG:4326 so I could get lon/lat).

6
  • Does the result improve if you add GCP on the Chinese coastline? And how does a degree grid fit to the imprinted grid markers?
    – AndreJ
    Commented Nov 22, 2013 at 7:03
  • Could you post the list of your GCP's?
    – Jake
    Commented Nov 22, 2013 at 8:42
  • @Jake done. See edit + pastebin.com/pWti0W8k Commented Nov 22, 2013 at 10:57
  • I'm interested to know why you think, that the original map has an accurate and correct projection? It might be just a diagram/drawing. Commented Nov 22, 2013 at 11:20
  • @DevdattaTengshe I had not at all considered that possibility, as I am not at all familiar with the cartographic practices of Encyc. Britannica. While georeferencing, I was surprised at the map's poor outline of Corsica and some of the small lakes, so there may be something to your thought. I would think that the outline of the continents would at least have originally been traced from a real projection? Commented Nov 22, 2013 at 12:37

1 Answer 1

1

The interpolation with polynoms or thin spline actually does not give you any clue about the projection used. You will always get "good" results if you use a high number of GCPs (unless you have an exotic projection not defined on the whole globe).

One thing that your method might bring is creating a degree grid and reproject it backward with the same GCPs to the maps original projection. Ogr2ogr can use gcp points since version 1.10.0.

With that you can make estimations about central meridian or parallels used.

2
  • "creating a degree grid and reproject it backward with the same GCPs to the maps original projection" <-- do you mean, use the polynomial 2 georeference solution to convert a lon/lat grid to pixels and overlay such a graticule on the image? And then make note of which meridians/parallels are straight and use that to guide the search for the projection (assuming this map has one)? Commented Nov 22, 2013 at 17:28
  • Yes, exactly. I will try on my own the next days.
    – AndreJ
    Commented Nov 22, 2013 at 19:57

Your Answer

By clicking “Post Your Answer”, you agree to our terms of service and acknowledge you have read our privacy policy.

Not the answer you're looking for? Browse other questions tagged or ask your own question.