1

I have bands 2, 3, 4, and 5 map.

How can I use these to make a color map in ArcGIS 10.1 for Desktop?

Can you give me steps?

Also I want to make attribute table of colormap.

How this can be done?

1
  • You need to specify what type of imagery you have. Can you clarify what you mean by colourmap/provide example? Commented Sep 22, 2014 at 17:29

1 Answer 1

1

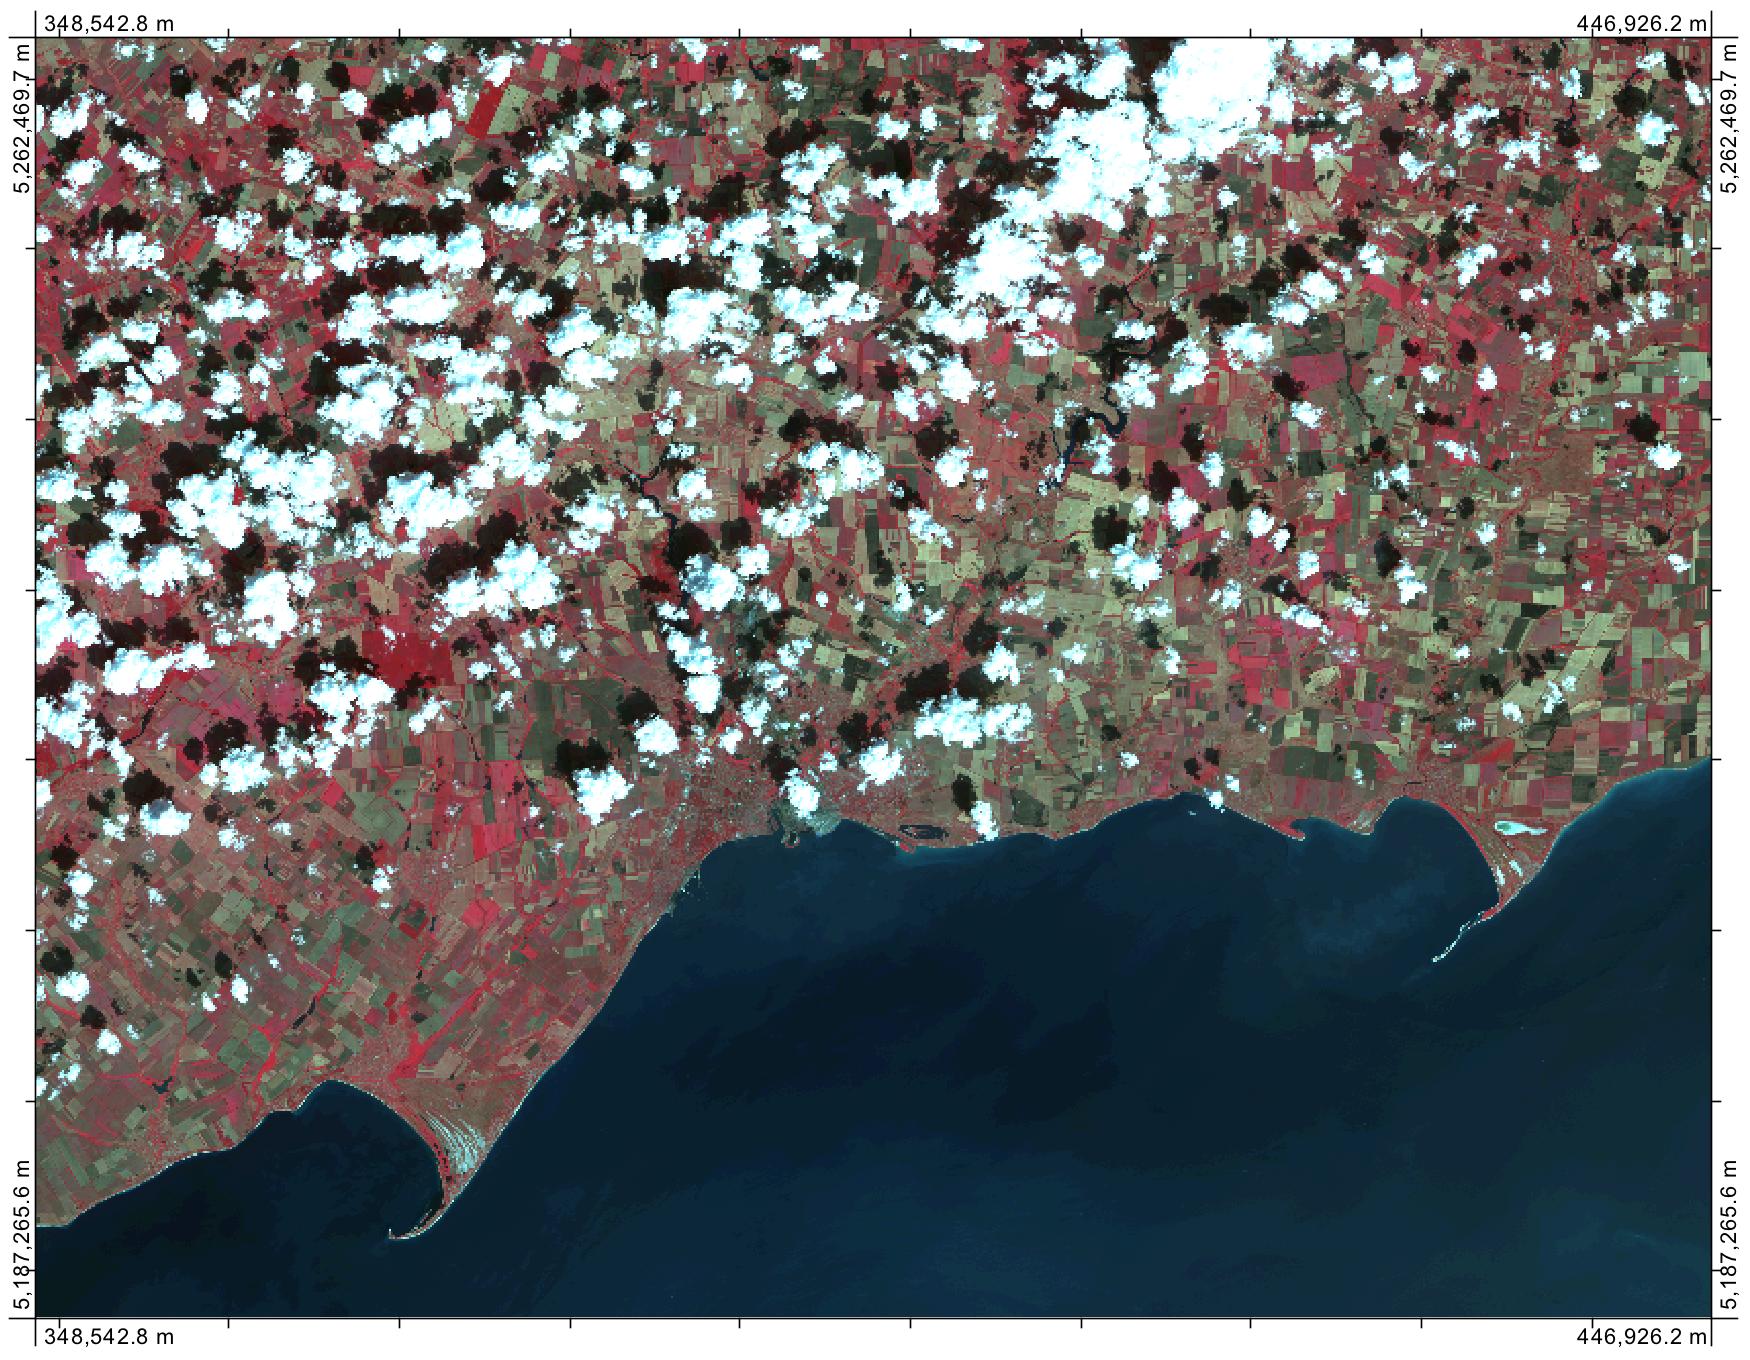
When you have multiple bands of imagery and you want to create a colour image, you need to create a red-green-blue (RGB) colour composite. The steps for doing this in ArcGIS can be found here. It helps if you know which part of the spectrum each of your bands are sampled from, which will depend on the satellite/sensor used to collect the imagery. If you want to create a natural-colour composite, you need to ensure that the red, green, and blue bands are added to the correct components of the composite, or else the resulting image will look quite natural. A false-colour infrared composite (see example below) can be created when you substitute the near-infrared band into the red component, the red into the green, and the green into the blue. You can derive all sorts of interesting information when you create this type of 'unnatural composite' using different band combinations. As for the attribute table, raster images don't generally have associated attribute tables. That's something that is more commonly associated with the vector data model (there are a few exceptions to this of course).
enter image description here

7
  • then how to convert raster image into vector data model?i need brightness value of vector data model and also i wants attribute table of brightness. how to convert RGB bands into single band?
    – onkar
    Commented Sep 20, 2014 at 20:18
  • @user36476 I'm somewhat confused by what you're asking. If it is the brightness value of each pixel, then that's the information that is stored in the image itself...the image is the 'attribute table' of pixel brightness. If instead, it is of larger patches of land that you are interested in, you would need to perform an image classification and then vectorize the result...each patch would contain a range of brightness values in each band however. It hard to answer your question without more details on what you are looking for. Commented Sep 20, 2014 at 20:51
  • @user36476 Also, the result of most RGB colour composite tools is a single 24-bit RGB image if that's what you mean be convert the RGB bands into a single band. Commented Sep 20, 2014 at 20:53
  • Sorry sir, I am giving you trouble. I am new learner in this. Simply I needs to generate attribute table which containing value and count of brightness values of RGB composite map, in this value should lies within 0-255 . Further I would to genarate graph of brightness value versus counts.
    – onkar
    Commented Sep 21, 2014 at 19:05
  • @user36476 It's no trouble, I just really don't know how to answer. RGB composites contain colour values (usually 24 or 32-bit) and not the range 0-255. I suppose you can get a measure of brightness for each pixel as: min(R, G, B) but it still will be contained in the pixel and not a table. As for the graph, if you create this min value image, simply perform an image histogram and you'll get what you need. Commented Sep 21, 2014 at 19:11

Your Answer

By clicking “Post Your Answer”, you agree to our terms of service and acknowledge you have read our privacy policy.

Not the answer you're looking for? Browse other questions tagged or ask your own question.