I'm a novice with advanced spatial interpolation, and I'm trying to use the Geostatistical Analyst to interpolate a surface based on borehole data, using Ordinary Kriging.
The help file explains how to explore the data using the Normal Quantile-Quantile plot:
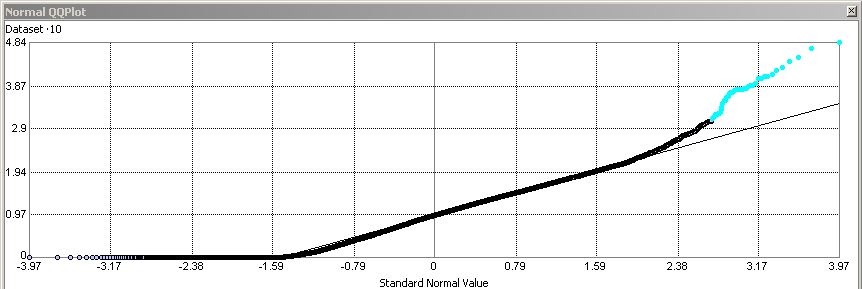
Points on the Normal QQ plot provide an indication of univariate normality of the dataset. If the data is normally distributed, the points will fall on the 45-degree reference line. If the data is not normally distributed, the points will deviate from the reference line.
The Normal QQ plot provides a visual comparison of your dataset to a standard normal distribution, and you can investigate points that cause departures from a normal distribution by selecting them in the plot and examining their locations on a map
I've selected the outliers in the Normal QQ plot for my dataset - what should I do next?

The help file mentions using a Log transformation to improve the distribution, but I don't have this option, only Arcsine. This makes no appreciable difference to the Normal QQ plot.
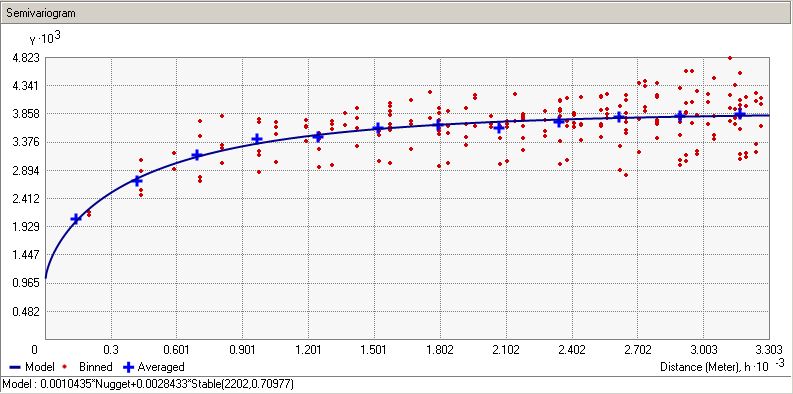
The blog entry Dealing with extreme values in kriging suggests excluding these points from the model - is this approach warranted here? My semivariogram is nowhere near as flat as the blog post example:

I've identified that the data are not perfectly normally distributed.
How can I quantify whether or not this is a problem?
