7

I have a raster dataset that is symbolized using Natural Breaks (Jenks) classification (9 classes). To reduce file size for web service display and download, I used the Reclassify tool to remap pixel values into 9 classes (class values were 1-9), and then used the Raster to Polygon tool to create a vector version of the dataset.
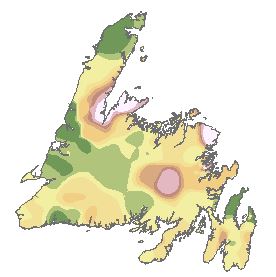
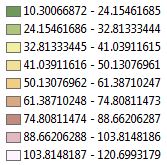
Water quality parameter - Colour legend

It was important to label polygon features based on the original raster symbology classification. So instead of a polygon labeled as 1, it would be labeled 10.3-24.2. To do this, the Remap Table was saved as an INFO table (functionality provided in the Reclassify tool window - see table below) and later joined to the polygon attributes table, in order to create a labeling field based on class range values.
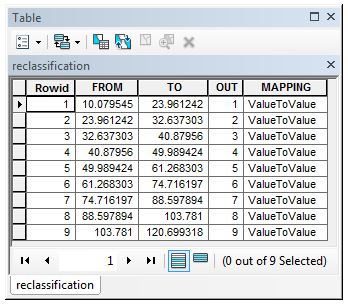
Remap Info Table

This process works fine by manually saving the Remap Table as an INFO table (click save button in the Reclassify tool window), but i need to automate the process, since i need to create about 100 of these maps.

Is there a way to automate the transfer of symbology information (class range values) of a raster to a polygon feature?

2
  • 1
    Rasters and vectors are two different entities. I've seen a few similar questions to this and they all end up with the same result: it is not possible to transfer colours from raster to vector. The best you could do is manually symbolize one polygon layer and then use Apply Symbology from Layer resources.arcgis.com/en/help/main/10.2/index.html#//… to copy the polygon symbology. Commented Dec 4, 2014 at 4:02
  • I had a chance to work on this further. I used the 'Zonal Statistics as Table' tool to get the Max and Min pixel values for each of my nine classes; used the reclassified raster to identify the nine zones and the original raster to extract the min and max values from. The zonal statistics table was then joined to the attributes table of my polygon layer, created from the reclassified raster. Aside note: The Dissolve tool was also used to simplify the polygon layer prior to joining tables.
    – KAbbott
    Commented Dec 5, 2014 at 13:17

1 Answer 1

3

How about:

  • Produce an RGB raster
  • Exporting to vector
  • Loop through each polygon's centroid and interrogate the rgb in the raster
  • Put the RGB value in the polygons attribute table (maybe you could ninja / modify a bit of code from the link below)
  • Symbolise a layer file for your range of RGB values, and apply that to your newly attributed vector polygons

SAVING RGB VALUES INTO A POLYGON ATT

Your Answer

By clicking “Post Your Answer”, you agree to our terms of service and acknowledge you have read our privacy policy.

Not the answer you're looking for? Browse other questions tagged or ask your own question.